|
Bath
Liberal Democrat hold

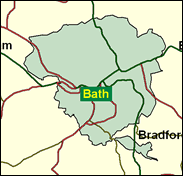
The Liberal Democrats returned by far the largest number of councillors on the new unitary authority of Bath and North East Somerset in its inaugural elections in 1999 and are strong favourites to hold the spa town again in the forthcoming general election. Don Foster capitalised on local election success to defeat the Conservative MP Chris Patten even as the latter was orchestrating John Major's single general election win in 1992. Patten has gone on to new challenges with the European Commission, but Foster is now established as a senior and well-entrenched Liberal Democrat.

Don Foster, who won the seat in 1992 is currently Lib Dem Environment spokesman, having long shadowed Education. An ambitious and abrasive former public school science teacher, he was born in 1947 and educated at Lancaster Royal Grammar School and Keele University, and reached Bath via educational research at Bristol University. He takes an urban PC line against rural interests such as gun control and hunting, and a suburban line against the scourge of Leylandii, and backs Lib-Lab tactical voting. In a seat held uninterruptedly by the Conservatives for 68 years before his victory, he faces 31-year-old Bristol solicitor Ashley Fox as his new Tory opponent.
 |
| Wealthy Achievers, Suburban Areas |
18.36% |
14.99% |
122.45 |
|
| Affluent Greys, Rural Communities |
0.00% |
2.13% |
0.00 |
|
| Prosperous Pensioners, Retirement Areas |
4.57% |
2.49% |
183.97 |
|
| Affluent Executives, Family Areas |
1.00% |
4.43% |
22.53 |
|
| Well-Off Workers, Family Areas |
1.22% |
7.27% |
16.83 |
|
| Affluent Urbanites, Town & City Areas |
11.00% |
2.56% |
428.72 |
|
| Prosperous Professionals, Metropolitan Areas |
0.57% |
2.04% |
27.93 |
|
| Better-Off Executives, Inner City Areas |
13.39% |
3.94% |
339.43 |
|
| Comfortable Middle Agers, Mature Home Owning Areas |
11.20% |
13.04% |
85.90 |
|
| Skilled Workers, Home Owning Areas |
8.02% |
12.70% |
63.16 |
|
| New Home Owners, Mature Communities |
9.18% |
8.14% |
112.75 |
|
| White Collar Workers, Better-Off Multi Ethnic Areas |
10.18% |
4.02% |
253.10 |
|
| Older People, Less Prosperous Areas |
3.45% |
3.19% |
108.40 |
|
| Council Estate Residents, Better-Off Homes |
5.79% |
11.31% |
51.21 |
|
| Council Estate Residents, High Unemployment |
1.45% |
3.06% |
47.23 |
|
| Council Estate Residents, Greatest Hardship |
0.58% |
2.52% |
23.22 |
|
| People in Multi-Ethnic, Low-Income Areas |
0.00% |
2.10% |
0.00 |
|
| Unclassified |
0.03% |
0.06% |
54.79 |
|
|
 |
 |
 |
| £0-5K |
9.91% |
9.41% |
105.28 |
|
| £5-10K |
16.76% |
16.63% |
100.78 |
|
| £10-15K |
16.65% |
16.58% |
100.41 |
|
| £15-20K |
13.66% |
13.58% |
100.55 |
|
| £20-25K |
10.45% |
10.39% |
100.56 |
|
| £25-30K |
7.80% |
7.77% |
100.37 |
|
| £30-35K |
5.79% |
5.79% |
99.99 |
|
| £35-40K |
4.31% |
4.33% |
99.49 |
|
| £40-45K |
3.23% |
3.27% |
98.90 |
|
| £45-50K |
2.44% |
2.48% |
98.28 |
|
| £50-55K |
1.86% |
1.90% |
97.63 |
|
| £55-60K |
1.43% |
1.47% |
96.98 |
|
| £60-65K |
1.11% |
1.15% |
96.33 |
|
| £65-70K |
0.87% |
0.91% |
95.70 |
|
| £70-75K |
0.68% |
0.72% |
95.09 |
|
| £75-80K |
0.54% |
0.57% |
94.50 |
|
| £80-85K |
0.43% |
0.46% |
93.92 |
|
| £85-90K |
0.35% |
0.37% |
93.37 |
|
| £90-95K |
0.28% |
0.31% |
92.83 |
|
| £95-100K |
0.23% |
0.25% |
92.31 |
|
| £100K + |
1.20% |
1.34% |
89.20 |
|
|
|

|


|
1992-1997
|
1997-2001
|
|
|
|
| Con |
-12.19% |
| Lab |
8.15% |
| LD |
1.57% |
|
| Con |
-2.10% |
| Lab |
-0.65% |
| LD |
2.01% |
|
|
 |
Don Foster
Liberal Democrat hold
|
| Con |
 |
13,478 |
29.11% |
| Lab |
 |
7,269 |
15.70% |
| LD |
 |
23,372 |
50.48% |
| Oth |
 |
2,177 |
4.70% |
| Maj |
 |
9,894 |
21.37% |
| Turn |
 |
46,296 |
64.87% |
|
|
 |
Don Foster
Liberal Democrat hold
|
| G |
Mike Boulton |
1,469 |
3.17% |
| LD |
Don Foster |
23,372 |
50.48% |
| C |
Ashley Fox |
13,478 |
29.11% |
| L |
Marilyn Hawkings |
7,269 |
15.70% |
| UK |
Andrew Tettenborn |
708 |
1.53% |
|
Candidates representing 5 parties stood for election to this seat.
|
|
 |
Don Foster
Liberal Democrat
|
| Con |
 |
16,850 |
31.21% |
| Lab |
 |
8,828 |
16.35% |
| LD |
 |
26,169 |
48.47% |
| Ref |
 |
1,192 |
2.21% |
| Oth |
 |
950 |
1.76% |
| Maj |
 |
9,319 |
17.26% |
| Turn |
 |
53,989 |
76.24% |
|
|
 |
|
Liberal Democrat
|
| Con |
 |
25,289 |
43.40% |
| Lab |
 |
4,761 |
8.20% |
| LD |
 |
27,298 |
46.90% |
| Oth |
 |
874 |
1.50% |
| Maj |
 |
2,009 |
3.50% |
| Turn |
 |
58,222 |
82.85% |
|
|
 |
|

|

