|
Hull East
Labour hold

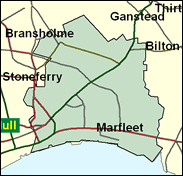
John Prescott's seat has been one of the most Labour in the country in the 30 years since he was first elected. The east end of the city contains it major industrial area including several square miles of commercial docks, with a higher than average proportion of council housing, single parenthood, and low car ownership. It looks as rough hewn as its distinctive MP, and is just as unlikely ever to even think of voting for any other party.

John Prescott, one of the few proles in Blair's Cabinet, as Bevin was in Attlee's, is no Ernie Bevin, much though he might wish to be, but nor is he the emotional embarrassment George Brown was to Harold Wilson. A chippy eleven-plus failure, born in 1938, who eventually reached Hull University via Ruskin, he is a former ships' steward and union official. To his irritation, cartoon-parodied as a bulldog with a zipped-up mouth, he may reach those parts of the Labour heartland Blair cannot reach, but it is hard to see where he goes when he leaves his unwieldy Environment Ministry, where the litany of an "integrated transport system" is endlessly intoned to the deaf ears of the Treasury. He has been seemingly pencilled in for the cul-de-sac of the Cabinet Office.
 |
| Wealthy Achievers, Suburban Areas |
0.32% |
14.99% |
2.13 |
|
| Affluent Greys, Rural Communities |
0.00% |
2.13% |
0.00 |
|
| Prosperous Pensioners, Retirement Areas |
0.28% |
2.49% |
11.22 |
|
| Affluent Executives, Family Areas |
1.68% |
4.43% |
38.04 |
|
| Well-Off Workers, Family Areas |
9.56% |
7.27% |
131.48 |
|
| Affluent Urbanites, Town & City Areas |
0.57% |
2.56% |
22.30 |
|
| Prosperous Professionals, Metropolitan Areas |
0.00% |
2.04% |
0.00 |
|
| Better-Off Executives, Inner City Areas |
0.68% |
3.94% |
17.35 |
|
| Comfortable Middle Agers, Mature Home Owning Areas |
5.07% |
13.04% |
38.85 |
|
| Skilled Workers, Home Owning Areas |
27.60% |
12.70% |
217.29 |
|
| New Home Owners, Mature Communities |
4.63% |
8.14% |
56.82 |
|
| White Collar Workers, Better-Off Multi Ethnic Areas |
0.00% |
4.02% |
0.00 |
|
| Older People, Less Prosperous Areas |
8.41% |
3.19% |
264.12 |
|
| Council Estate Residents, Better-Off Homes |
29.05% |
11.31% |
256.79 |
|
| Council Estate Residents, High Unemployment |
1.36% |
3.06% |
44.42 |
|
| Council Estate Residents, Greatest Hardship |
10.78% |
2.52% |
428.15 |
|
| People in Multi-Ethnic, Low-Income Areas |
0.00% |
2.10% |
0.00 |
|
| Unclassified |
0.00% |
0.06% |
0.00 |
|
|
 |
 |
 |
| £0-5K |
16.38% |
9.41% |
174.05 |
|
| £5-10K |
25.09% |
16.63% |
150.84 |
|
| £10-15K |
20.25% |
16.58% |
122.13 |
|
| £15-20K |
13.51% |
13.58% |
99.45 |
|
| £20-25K |
8.57% |
10.39% |
82.45 |
|
| £25-30K |
5.41% |
7.77% |
69.55 |
|
| £30-35K |
3.45% |
5.79% |
59.54 |
|
| £35-40K |
2.24% |
4.33% |
51.60 |
|
| £40-45K |
1.48% |
3.27% |
45.21 |
|
| £45-50K |
0.99% |
2.48% |
39.99 |
|
| £50-55K |
0.68% |
1.90% |
35.68 |
|
| £55-60K |
0.47% |
1.47% |
32.09 |
|
| £60-65K |
0.33% |
1.15% |
29.06 |
|
| £65-70K |
0.24% |
0.91% |
26.49 |
|
| £70-75K |
0.17% |
0.72% |
24.29 |
|
| £75-80K |
0.13% |
0.57% |
22.39 |
|
| £80-85K |
0.10% |
0.46% |
20.73 |
|
| £85-90K |
0.07% |
0.37% |
19.29 |
|
| £90-95K |
0.05% |
0.31% |
18.01 |
|
| £95-100K |
0.04% |
0.25% |
16.88 |
|
| £100K + |
0.16% |
1.34% |
12.25 |
|
|
|

|


|
1992-1997
|
1997-2001
|
|
|
|
| Con |
-10.09% |
| Lab |
8.41% |
| LD |
-2.81% |
|
| Con |
0.14% |
| Lab |
-6.73% |
| LD |
5.15% |
|
|
 |
John Prescott
Labour hold
|
| Con |
 |
4,276 |
13.85% |
| Lab |
 |
19,938 |
64.58% |
| LD |
 |
4,613 |
14.94% |
| Oth |
 |
2,048 |
6.63% |
| Maj |
 |
15,325 |
49.64% |
| Turn |
 |
30,875 |
46.45% |
|
|
 |
John Prescott
Labour hold
|
| UK |
Jeanette Jenkinson |
1,218 |
3.94% |
| SL |
Linda Muir |
830 |
2.69% |
| L |
John Prescott |
19,938 |
64.58% |
| LD |
Jo Swinson |
4,613 |
14.94% |
| C |
Sandip Verma |
4,276 |
13.85% |
|
Candidates representing 5 parties stood for election to this seat.
|
|
 |
John Prescott
Labour
|
| Con |
 |
5,552 |
13.71% |
| Lab |
 |
28,870 |
71.31% |
| LD |
 |
3,965 |
9.79% |
| Ref |
 |
1,788 |
4.42% |
| Oth |
 |
311 |
0.77% |
| Maj |
 |
23,318 |
57.60% |
| Turn |
 |
40,486 |
58.90% |
|
|
 |
|
Labour
|
| Con |
 |
11,373 |
23.80% |
| Lab |
 |
30,096 |
62.90% |
| LD |
 |
6,050 |
12.60% |
| Oth |
 |
323 |
0.70% |
| Maj |
 |
18,723 |
39.10% |
| Turn |
 |
47,842 |
68.67% |
|
|
 |
|

|

