|
Hull North
Labour hold

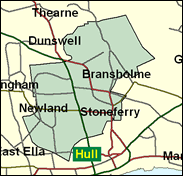
Hull has consistently the lowest turnouts in council elections, and this pattern is maintained in General contests to choose a government for the United Kingdom. In 1997 for example, only 57 per cent of those on the register in Hull North voted compared with a national average of 71 per cent. This may be because the voters are satisfied with Labour representation at both local and parliamentary level; certainly there is no serious dispute about who wins here. It could also be due to alienation from this democratic process itself, the belief that voting will not make a difference. Hull North contains the most deprived council estate wards in the city, in Noddle Hill and Orchard Park on the north eastern edge of the conurbation, and it can scarcely be said that the level of interest in the minutiae of politics is high; people are scraping to make a living.

Kevin McNamara, a koala-bear lookalike and Liverpool Irishman, born in 1934 and educated at St. Mary's (RC) College, Crosby, and Hull University, has been an MP here since winning the 1966 by-election that prompted Wilson to hold a snap general election and win a 97-seat majority. Far too green to represent Labour's Northern Ireland policy in government as he had in opposition, he left the front bench in 1995, and failed to change the Oath of Allegiance to let in the Sinn Fein MPs in 1998. He has rebelled on lone parent and disability benefit cuts.
 |
| Wealthy Achievers, Suburban Areas |
0.62% |
14.99% |
4.13 |
|
| Affluent Greys, Rural Communities |
0.00% |
2.13% |
0.00 |
|
| Prosperous Pensioners, Retirement Areas |
0.33% |
2.49% |
13.15 |
|
| Affluent Executives, Family Areas |
0.52% |
4.43% |
11.73 |
|
| Well-Off Workers, Family Areas |
7.78% |
7.27% |
106.97 |
|
| Affluent Urbanites, Town & City Areas |
3.69% |
2.56% |
143.90 |
|
| Prosperous Professionals, Metropolitan Areas |
0.00% |
2.04% |
0.00 |
|
| Better-Off Executives, Inner City Areas |
9.98% |
3.94% |
253.15 |
|
| Comfortable Middle Agers, Mature Home Owning Areas |
5.35% |
13.04% |
41.02 |
|
| Skilled Workers, Home Owning Areas |
21.35% |
12.70% |
168.05 |
|
| New Home Owners, Mature Communities |
1.52% |
8.14% |
18.65 |
|
| White Collar Workers, Better-Off Multi Ethnic Areas |
3.97% |
4.02% |
98.61 |
|
| Older People, Less Prosperous Areas |
1.77% |
3.19% |
55.53 |
|
| Council Estate Residents, Better-Off Homes |
16.70% |
11.31% |
147.65 |
|
| Council Estate Residents, High Unemployment |
1.80% |
3.06% |
58.85 |
|
| Council Estate Residents, Greatest Hardship |
24.63% |
2.52% |
977.92 |
|
| People in Multi-Ethnic, Low-Income Areas |
0.00% |
2.10% |
0.00 |
|
| Unclassified |
0.00% |
0.06% |
0.00 |
|
|
 |
|
|
| £0-5K |
15.26% |
9.41% |
162.07 |
|
| £5-10K |
22.96% |
16.63% |
138.03 |
|
| £10-15K |
19.43% |
16.58% |
117.17 |
|
| £15-20K |
13.68% |
13.58% |
100.75 |
|
| £20-25K |
9.12% |
10.39% |
87.74 |
|
| £25-30K |
6.01% |
7.77% |
77.24 |
|
| £30-35K |
3.98% |
5.79% |
68.68 |
|
| £35-40K |
2.67% |
4.33% |
61.64 |
|
| £40-45K |
1.82% |
3.27% |
55.84 |
|
| £45-50K |
1.27% |
2.48% |
51.02 |
|
| £50-55K |
0.90% |
1.90% |
47.02 |
|
| £55-60K |
0.64% |
1.47% |
43.68 |
|
| £60-65K |
0.47% |
1.15% |
40.88 |
|
| £65-70K |
0.35% |
0.91% |
38.52 |
|
| £70-75K |
0.26% |
0.72% |
36.52 |
|
| £75-80K |
0.20% |
0.57% |
34.82 |
|
| £80-85K |
0.15% |
0.46% |
33.36 |
|
| £85-90K |
0.12% |
0.37% |
32.11 |
|
| £90-95K |
0.09% |
0.31% |
31.03 |
|
| £95-100K |
0.08% |
0.25% |
30.09 |
|
| £100K + |
0.36% |
1.34% |
26.64 |
|
|
|
|


|
1992-1997
|
1997-2001
|
|
|
|
| Con |
-8.55% |
| Lab |
9.94% |
| LD |
-5.39% |
|
| Con |
2.07% |
| Lab |
-8.69% |
| LD |
5.10% |
|
|
|
Kevin McNamara
Labour hold
|
| Con |
 |
4,902 |
17.12% |
| Lab |
 |
16,364 |
57.15% |
| LD |
 |
5,643 |
19.71% |
| Oth |
 |
1,724 |
6.02% |
| Maj |
 |
10,721 |
37.44% |
| Turn |
|
28,633 |
45.43% |
|
|
|
Kevin McNamara
Labour hold
|
| LD |
Simone Butterworth |
5,643 |
19.71% |
| C |
Paul Charlson |
4,902 |
17.12% |
| L |
Kevin McNamara |
16,364 |
57.15% |
| UK |
Tineka Robinson |
655 |
2.29% |
| SA |
Roger Smith |
490 |
1.71% |
| I |
Christopher Veasey |
101 |
0.35% |
| LCA |
Carl Wagner |
478 |
1.67% |
|
Candidates representing 7 parties stood for election to this seat.
|
|
|
Kevin McNamarra
Labour
|
| Con |
|
5,837 |
15.05% |
| Lab |
|
25,542 |
65.84% |
| LD |
|
5,667 |
14.61% |
| Ref |
 |
1,533 |
3.95% |
| Oth |
|
215 |
0.55% |
| Maj |
|
19,705 |
50.79% |
| Turn |
|
38,794 |
56.96% |
|
|
|
|
Labour
|
| Con |
|
11,235 |
23.60% |
| Lab |
|
26,619 |
55.90% |
| LD |
|
9,504 |
20.00% |
| Oth |
|
254 |
0.50% |
| Maj |
|
15,384 |
32.30% |
| Turn |
|
47,612 |
65.70% |
|
|
|
|
|