|
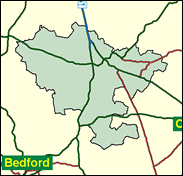
Huntingdon
Conservative hold

This is the safest Conservative seat in terms of both numerical (18,000) and percentage majority in 1997. However, an unknown quantity of this was due to the personal vote of John Major, a very attractive figure to almost all those who have met him. These people are numerous in his constituency of over twenty years, Huntingdon, and on his retirement a new candidate from considerably further Right in the party may slip down the list of absolute safety a little after the next General Election (perhaps Michael Portillo in Kensington and Chelsea will take over at the top, ironically after his 1997 defeat) - but not very far.

In the steps of Worcester Park man comes Jonathan Djanogly, a rightwing opponent of the Euro, who unexpectedly beat a pro-European barrister and Tory Reform Group member, David Platt for the Conservative nomination. Dark and long-headed and from a wealthy family of manufacturers, he was born in 1965 and educated at University College School, Hampstead, Oxford Polytechnic and Guildford College of Law. A former councillor (1994-98) in Shirley Porter's Westminster, he fought Oxford East in 1997. Thrustingly ambitious, he became a partner with the London solicitors' firm of Berwins in 1998, aged 33, and founded an audio cassette business with his wife in 1994.
 |
| Wealthy Achievers, Suburban Areas |
27.17% |
14.99% |
181.22 |
|
| Affluent Greys, Rural Communities |
0.21% |
2.13% |
9.72 |
|
| Prosperous Pensioners, Retirement Areas |
1.28% |
2.49% |
51.34 |
|
| Affluent Executives, Family Areas |
22.70% |
4.43% |
512.93 |
|
| Well-Off Workers, Family Areas |
10.99% |
7.27% |
151.14 |
|
| Affluent Urbanites, Town & City Areas |
1.48% |
2.56% |
57.72 |
|
| Prosperous Professionals, Metropolitan Areas |
0.08% |
2.04% |
3.74 |
|
| Better-Off Executives, Inner City Areas |
0.16% |
3.94% |
4.09 |
|
| Comfortable Middle Agers, Mature Home Owning Areas |
9.78% |
13.04% |
75.00 |
|
| Skilled Workers, Home Owning Areas |
6.25% |
12.70% |
49.21 |
|
| New Home Owners, Mature Communities |
4.76% |
8.14% |
58.42 |
|
| White Collar Workers, Better-Off Multi Ethnic Areas |
1.88% |
4.02% |
46.76 |
|
| Older People, Less Prosperous Areas |
1.51% |
3.19% |
47.50 |
|
| Council Estate Residents, Better-Off Homes |
10.88% |
11.31% |
96.20 |
|
| Council Estate Residents, High Unemployment |
0.26% |
3.06% |
8.46 |
|
| Council Estate Residents, Greatest Hardship |
0.30% |
2.52% |
11.73 |
|
| People in Multi-Ethnic, Low-Income Areas |
0.00% |
2.10% |
0.00 |
|
| Unclassified |
0.32% |
0.06% |
513.63 |
|
|
 |
 |
 |
| £0-5K |
5.37% |
9.41% |
57.08 |
|
| £5-10K |
11.98% |
16.63% |
72.04 |
|
| £10-15K |
14.25% |
16.58% |
85.94 |
|
| £15-20K |
13.35% |
13.58% |
98.29 |
|
| £20-25K |
11.30% |
10.39% |
108.76 |
|
| £25-30K |
9.12% |
7.77% |
117.34 |
|
| £30-35K |
7.19% |
5.79% |
124.17 |
|
| £35-40K |
5.61% |
4.33% |
129.47 |
|
| £40-45K |
4.36% |
3.27% |
133.48 |
|
| £45-50K |
3.39% |
2.48% |
136.43 |
|
| £50-55K |
2.64% |
1.90% |
138.52 |
|
| £55-60K |
2.06% |
1.47% |
139.92 |
|
| £60-65K |
1.62% |
1.15% |
140.76 |
|
| £65-70K |
1.28% |
0.91% |
141.17 |
|
| £70-75K |
1.02% |
0.72% |
141.24 |
|
| £75-80K |
0.81% |
0.57% |
141.03 |
|
| £80-85K |
0.65% |
0.46% |
140.62 |
|
| £85-90K |
0.52% |
0.37% |
140.04 |
|
| £90-95K |
0.43% |
0.31% |
139.34 |
|
| £95-100K |
0.35% |
0.25% |
138.55 |
|
| £100K + |
1.77% |
1.34% |
131.75 |
|
|
|

|


|
1992-1997
|
1997-2001
|
|
|
|
| Con |
-4.70% |
| Lab |
8.96% |
| LD |
-6.67% |
|
| Con |
-5.38% |
| Lab |
-0.62% |
| LD |
9.14% |
|
|
 |
Jonathan Djanogly
Conservative hold
|
| Con |
 |
24,507 |
49.92% |
| Lab |
 |
11,211 |
22.84% |
| LD |
 |
11,715 |
23.86% |
| Oth |
 |
1,656 |
3.37% |
| Maj |
 |
12,792 |
26.06% |
| Turn |
 |
49,089 |
62.45% |
|
|
 |
Jonathan Djanogly
Conservative hold
|
| C |
Jonathan Djanogly |
24,507 |
49.92% |
| UK |
Derek Norman |
1,656 |
3.37% |
| LD |
Michael Pope |
11,715 |
23.86% |
| L |
Takki Sulaiman |
11,211 |
22.84% |
|
Candidates representing 4 parties stood for election to this seat.
|
|
 |
John Major
Conservative
|
| Con |
 |
31,501 |
55.30% |
| Lab |
 |
13,361 |
23.46% |
| LD |
 |
8,390 |
14.73% |
| Ref |
 |
3,114 |
5.47% |
| Oth |
 |
597 |
1.05% |
| Maj |
 |
18,140 |
31.85% |
| Turn |
 |
56,963 |
74.86% |
|
|
 |
|
Conservative
|
| Con |
 |
34,124 |
60.00% |
| Lab |
 |
8,234 |
14.50% |
| LD |
 |
12,153 |
21.40% |
| Oth |
 |
2,342 |
4.10% |
| Maj |
 |
21,971 |
38.60% |
| Turn |
 |
56,853 |
79.62% |
|
|
 |
|

|

