|
Hyndburn
Labour hold

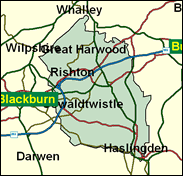
This classic Lancashire marginal based on the town of Accrington, the very heart of Lancashire league cricket and its production and consumption of pies, may once again produce a close result. It has a history of swinging with the tide in both national and local elections, where most of the wards are marginal. In May 2000 hope rose for the nationally beleaguered Conservative Party as they won 13 out of 18 council seats in Hyndburn, and outvoted Labour in a classic two-party battle by 56 per cent to 43 per cent. They also won the two Rossendale Borough wards in the Hyndburn seat. Look out for a decisive and important battle.

Greg Pope, a government Whip, was elected in 1992 and has followed a path of loyal semi-obscurity since his initial vote against the Maastricht Treaty on grounds of the social chapter opt-out. His campaigning for Blair's Clause 4 redraft earned him appointment as an Opposition Whip in 1995. A former local government officer, he was born in 1960 and educated at St. Mary's (RC) College, Blackburn, and Hull University. He is a practising Catholic, whose name appears on the ballot paper as 'Pope Gregory'.
 |
| Wealthy Achievers, Suburban Areas |
2.78% |
14.99% |
18.53 |
|
| Affluent Greys, Rural Communities |
0.00% |
2.13% |
0.00 |
|
| Prosperous Pensioners, Retirement Areas |
0.00% |
2.49% |
0.00 |
|
| Affluent Executives, Family Areas |
2.64% |
4.43% |
59.56 |
|
| Well-Off Workers, Family Areas |
10.85% |
7.27% |
149.22 |
|
| Affluent Urbanites, Town & City Areas |
0.00% |
2.56% |
0.00 |
|
| Prosperous Professionals, Metropolitan Areas |
0.00% |
2.04% |
0.00 |
|
| Better-Off Executives, Inner City Areas |
0.00% |
3.94% |
0.00 |
|
| Comfortable Middle Agers, Mature Home Owning Areas |
3.87% |
13.04% |
29.69 |
|
| Skilled Workers, Home Owning Areas |
50.56% |
12.70% |
398.02 |
|
| New Home Owners, Mature Communities |
3.45% |
8.14% |
42.36 |
|
| White Collar Workers, Better-Off Multi Ethnic Areas |
0.22% |
4.02% |
5.52 |
|
| Older People, Less Prosperous Areas |
4.37% |
3.19% |
137.29 |
|
| Council Estate Residents, Better-Off Homes |
15.35% |
11.31% |
135.71 |
|
| Council Estate Residents, High Unemployment |
2.14% |
3.06% |
69.88 |
|
| Council Estate Residents, Greatest Hardship |
1.02% |
2.52% |
40.54 |
|
| People in Multi-Ethnic, Low-Income Areas |
2.74% |
2.10% |
130.66 |
|
| Unclassified |
0.00% |
0.06% |
0.00 |
|
|
 |
 |
 |
| £0-5K |
11.04% |
9.41% |
117.23 |
|
| £5-10K |
20.52% |
16.63% |
123.36 |
|
| £10-15K |
19.45% |
16.58% |
117.30 |
|
| £15-20K |
14.67% |
13.58% |
107.97 |
|
| £20-25K |
10.26% |
10.39% |
98.70 |
|
| £25-30K |
7.03% |
7.77% |
90.40 |
|
| £30-35K |
4.82% |
5.79% |
83.18 |
|
| £35-40K |
3.33% |
4.33% |
76.91 |
|
| £40-45K |
2.33% |
3.27% |
71.43 |
|
| £45-50K |
1.65% |
2.48% |
66.62 |
|
| £50-55K |
1.19% |
1.90% |
62.36 |
|
| £55-60K |
0.86% |
1.47% |
58.55 |
|
| £60-65K |
0.63% |
1.15% |
55.13 |
|
| £65-70K |
0.47% |
0.91% |
52.04 |
|
| £70-75K |
0.35% |
0.72% |
49.24 |
|
| £75-80K |
0.27% |
0.57% |
46.68 |
|
| £80-85K |
0.21% |
0.46% |
44.35 |
|
| £85-90K |
0.16% |
0.37% |
42.21 |
|
| £90-95K |
0.12% |
0.31% |
40.24 |
|
| £95-100K |
0.10% |
0.25% |
38.42 |
|
| £100K + |
0.40% |
1.34% |
29.86 |
|
|
|

|


|
1992-1997
|
1997-2001
|
|
|
|
| Con |
-11.33% |
| Lab |
8.78% |
| LD |
-1.02% |
|
| Con |
1.29% |
| Lab |
-0.93% |
| LD |
1.04% |
|
|
 |
Greg Pope
Labour hold
|
| Con |
 |
12,681 |
33.16% |
| Lab |
 |
20,900 |
54.65% |
| LD |
 |
3,680 |
9.62% |
| Oth |
 |
982 |
2.57% |
| Maj |
 |
8,219 |
21.49% |
| Turn |
 |
38,243 |
57.56% |
|
|
 |
Greg Pope
Labour hold
|
| C |
Peter Britcliffe |
12,681 |
33.16% |
| LD |
Bill Greene |
3,680 |
9.62% |
| L |
Greg Pope |
20,900 |
54.65% |
| UK |
John Tomlin |
982 |
2.57% |
|
Candidates representing 4 parties stood for election to this seat.
|
|
 |
Greg Pope
Labour
|
| Con |
 |
15,383 |
31.87% |
| Lab |
 |
26,831 |
55.58% |
| LD |
 |
4,141 |
8.58% |
| Ref |
 |
1,627 |
3.37% |
| Oth |
 |
290 |
0.60% |
| Maj |
 |
11,448 |
23.72% |
| Turn |
 |
48,272 |
72.26% |
|
|
 |
|
Labour
|
| Con |
 |
23,995 |
43.20% |
| Lab |
 |
26,026 |
46.80% |
| LD |
 |
5,314 |
9.60% |
| Oth |
 |
219 |
0.40% |
| Maj |
 |
2,031 |
3.70% |
| Turn |
 |
55,554 |
83.21% |
|
|
 |
|

|

