|
Ilford North
Labour hold

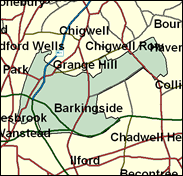
Always the most Conservative half of Ilford in the Borough of Redbridge in Outer North East London (or "Essex"), the boundary changes in 1997 which brought in part of the abolished Wanstead and Woodford seat forever associated with Winston Churchill seemed likely to make North forever Tory - after all, Labour only held the old Ilford North, on better boundaries for eight months in 1974. Yet Linda Perham did win, after a gigantic swing of over 17 per cent. This was a straight exchange of votes between Conservative and Labour: the Liberal Democrats were hardly squeezed, and the Referendum party did not stand. It must surely be near the very top of the Conservative shopping list next time, and long term MP Vivian Bendall certainly thinks it worth another go at the age of 62.

Linda Perham, elected in 1997 as an MP representing a lot of Jewish and black-cab-driving voters, takes a strong line against racism and backs attempts to regulate unlicensed and dangerous minicab drivers. Born in 1947, she was educated at Mary Datchelor Girls' School, Camberwell, Leicester University and Ealing Technical College and worked as a librarian. She favours compulsory voting.
 |
| Wealthy Achievers, Suburban Areas |
11.19% |
14.99% |
74.64 |
|
| Affluent Greys, Rural Communities |
0.00% |
2.13% |
0.00 |
|
| Prosperous Pensioners, Retirement Areas |
2.84% |
2.49% |
114.14 |
|
| Affluent Executives, Family Areas |
0.25% |
4.43% |
5.54 |
|
| Well-Off Workers, Family Areas |
2.21% |
7.27% |
30.35 |
|
| Affluent Urbanites, Town & City Areas |
0.99% |
2.56% |
38.56 |
|
| Prosperous Professionals, Metropolitan Areas |
6.20% |
2.04% |
303.99 |
|
| Better-Off Executives, Inner City Areas |
0.06% |
3.94% |
1.49 |
|
| Comfortable Middle Agers, Mature Home Owning Areas |
23.38% |
13.04% |
179.29 |
|
| Skilled Workers, Home Owning Areas |
21.90% |
12.70% |
172.41 |
|
| New Home Owners, Mature Communities |
6.78% |
8.14% |
83.26 |
|
| White Collar Workers, Better-Off Multi Ethnic Areas |
14.84% |
4.02% |
369.04 |
|
| Older People, Less Prosperous Areas |
4.25% |
3.19% |
133.40 |
|
| Council Estate Residents, Better-Off Homes |
1.92% |
11.31% |
17.00 |
|
| Council Estate Residents, High Unemployment |
1.76% |
3.06% |
57.42 |
|
| Council Estate Residents, Greatest Hardship |
0.00% |
2.52% |
0.00 |
|
| People in Multi-Ethnic, Low-Income Areas |
1.44% |
2.10% |
68.40 |
|
| Unclassified |
0.00% |
0.06% |
0.00 |
|
|
 |
 |
 |
| £0-5K |
6.56% |
9.41% |
69.71 |
|
| £5-10K |
12.11% |
16.63% |
72.80 |
|
| £10-15K |
13.50% |
16.58% |
81.41 |
|
| £15-20K |
12.40% |
13.58% |
91.27 |
|
| £20-25K |
10.51% |
10.39% |
101.11 |
|
| £25-30K |
8.59% |
7.77% |
110.46 |
|
| £30-35K |
6.90% |
5.79% |
119.16 |
|
| £35-40K |
5.51% |
4.33% |
127.15 |
|
| £40-45K |
4.39% |
3.27% |
134.46 |
|
| £45-50K |
3.50% |
2.48% |
141.12 |
|
| £50-55K |
2.80% |
1.90% |
147.20 |
|
| £55-60K |
2.25% |
1.47% |
152.75 |
|
| £60-65K |
1.82% |
1.15% |
157.83 |
|
| £65-70K |
1.47% |
0.91% |
162.49 |
|
| £70-75K |
1.20% |
0.72% |
166.77 |
|
| £75-80K |
0.98% |
0.57% |
170.71 |
|
| £80-85K |
0.81% |
0.46% |
174.35 |
|
| £85-90K |
0.67% |
0.37% |
177.73 |
|
| £90-95K |
0.55% |
0.31% |
180.86 |
|
| £95-100K |
0.46% |
0.25% |
183.78 |
|
| £100K + |
2.66% |
1.34% |
198.17 |
|
|
|

|


|
1992-1997
|
1997-2001
|
|
|
|
| Con |
-17.04% |
| Lab |
17.46% |
| LD |
-1.96% |
|
| Con |
-0.22% |
| Lab |
-1.56% |
| LD |
1.39% |
|
|
 |
Linda Perham
Labour hold
|
| Con |
 |
16,313 |
40.55% |
| Lab |
 |
18,428 |
45.80% |
| LD |
 |
4,717 |
11.72% |
| Oth |
 |
776 |
1.93% |
| Maj |
 |
2,115 |
5.26% |
| Turn |
 |
40,234 |
58.40% |
|
|
 |
Linda Perham
Labour hold
|
| C |
Vivian Bendall |
16,313 |
40.55% |
| UK |
Martin Levin |
776 |
1.93% |
| L |
Linda Perham |
18,428 |
45.80% |
| LD |
Gavin Stollar |
4,717 |
11.72% |
|
Candidates representing 4 parties stood for election to this seat.
|
|
 |
Linda Perham
Labour gain
|
| Con |
 |
19,911 |
40.76% |
| Lab |
 |
23,135 |
47.36% |
| LD |
 |
5,049 |
10.34% |
| Ref |
|
0 |
0.00% |
| Oth |
 |
750 |
1.54% |
| Maj |
 |
3,224 |
6.60% |
| Turn |
 |
48,845 |
71.60% |
|
|
 |
|
Conservative
|
| Con |
 |
29,076 |
57.80% |
| Lab |
 |
15,027 |
29.90% |
| LD |
 |
6,174 |
12.30% |
| Oth |
|
0 |
0.00% |
| Maj |
 |
14,049 |
27.90% |
| Turn |
 |
50,277 |
74.04% |
|
|
 |
|

|

