|
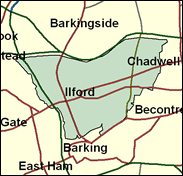
Ilford South
Labour hold

With a lead of no less than 28pc from 1997, and a rising proportion of ethnic minority voters, this one-time marginal now looks very safely Labour. They were 13pc ahead of the Tories here in the Redbridge Borough elections of 1998, and even more encouragingly, 16pc ahead within the seat in the European elections of June 1999, the occasion of New Labour's worst national performance. This result in particular suggests that Ilford South can no longer be regarded as a marginal, unlike some of Labour's gains in 1992 like Hyndburn and Rossendale/Darwen in Lancashire. It should be remembered that the proportion of non-white voters rose from 20pc in 1981 to 36pc in 1991, a very steep climb, and while we do not yet know for certain whether this pattern has continued over the last ten years it may well help explain the heavy long-term shift towards Labour. Loxford ward was already majority non-white in 1991, and other areas may go down that road too. The housing stock is particularly suited to rapid change of residency. Only four pc is council-owned, one of the lowest figures anywhere in the UK, and 80pc owner-occupied; but this is not expensive property by London standards but mainly consists of nineteenth century terraces, densely packed and inner city in appearance. It all adds up to a seat which should be getting safer for Mike Gapes, but he will have to watch out for the possibility of an independent Muslim candidature.

Mike Gapes, elected here in 1992, was for 15 years a Labour Party apparatchik, eventually emerging as a foreign policy specialist. Born 1952 and educated at Buckhurst Hill County High School and Fitzwilliam College, Cambridge, he is strongly pro-European in preference to Britain becoming "an amusement park for American and Japanese tourists". He was PPS to Northern Ireland Minister, Paul Murphy.
 |
| Wealthy Achievers, Suburban Areas |
1.19% |
14.99% |
7.91 |
|
| Affluent Greys, Rural Communities |
0.00% |
2.13% |
0.00 |
|
| Prosperous Pensioners, Retirement Areas |
1.22% |
2.49% |
49.25 |
|
| Affluent Executives, Family Areas |
0.02% |
4.43% |
0.48 |
|
| Well-Off Workers, Family Areas |
0.00% |
7.27% |
0.00 |
|
| Affluent Urbanites, Town & City Areas |
4.79% |
2.56% |
186.67 |
|
| Prosperous Professionals, Metropolitan Areas |
5.24% |
2.04% |
256.77 |
|
| Better-Off Executives, Inner City Areas |
6.02% |
3.94% |
152.65 |
|
| Comfortable Middle Agers, Mature Home Owning Areas |
6.11% |
13.04% |
46.86 |
|
| Skilled Workers, Home Owning Areas |
11.68% |
12.70% |
91.96 |
|
| New Home Owners, Mature Communities |
0.01% |
8.14% |
0.10 |
|
| White Collar Workers, Better-Off Multi Ethnic Areas |
54.52% |
4.02% |
1,355.57 |
|
| Older People, Less Prosperous Areas |
0.32% |
3.19% |
9.93 |
|
| Council Estate Residents, Better-Off Homes |
0.00% |
11.31% |
0.00 |
|
| Council Estate Residents, High Unemployment |
0.00% |
3.06% |
0.00 |
|
| Council Estate Residents, Greatest Hardship |
0.00% |
2.52% |
0.00 |
|
| People in Multi-Ethnic, Low-Income Areas |
8.87% |
2.10% |
422.22 |
|
| Unclassified |
0.02% |
0.06% |
34.26 |
|
|
 |
 |
 |
| £0-5K |
5.08% |
9.41% |
53.98 |
|
| £5-10K |
11.41% |
16.63% |
68.58 |
|
| £10-15K |
13.82% |
16.58% |
83.37 |
|
| £15-20K |
13.16% |
13.58% |
96.92 |
|
| £20-25K |
11.30% |
10.39% |
108.70 |
|
| £25-30K |
9.23% |
7.77% |
118.68 |
|
| £30-35K |
7.36% |
5.79% |
127.02 |
|
| £35-40K |
5.80% |
4.33% |
133.93 |
|
| £40-45K |
4.56% |
3.27% |
139.61 |
|
| £45-50K |
3.58% |
2.48% |
144.28 |
|
| £50-55K |
2.82% |
1.90% |
148.09 |
|
| £55-60K |
2.23% |
1.47% |
151.20 |
|
| £60-65K |
1.77% |
1.15% |
153.73 |
|
| £65-70K |
1.41% |
0.91% |
155.78 |
|
| £70-75K |
1.13% |
0.72% |
157.42 |
|
| £75-80K |
0.91% |
0.57% |
158.74 |
|
| £80-85K |
0.74% |
0.46% |
159.78 |
|
| £85-90K |
0.60% |
0.37% |
160.58 |
|
| £90-95K |
0.49% |
0.31% |
161.20 |
|
| £95-100K |
0.40% |
0.25% |
161.65 |
|
| £100K + |
2.17% |
1.34% |
161.12 |
|
|
|

|


|
1992-1997
|
1997-2001
|
|
|
|
| Con |
-16.77% |
| Lab |
16.42% |
| LD |
-4.10% |
|
| Con |
-4.41% |
| Lab |
1.09% |
| LD |
4.95% |
|
|
 |
Mike Gapes
Labour hold
|
| Con |
 |
10,622 |
25.72% |
| Lab |
 |
24,619 |
59.62% |
| LD |
 |
4,647 |
11.25% |
| Oth |
 |
1,407 |
3.41% |
| Maj |
 |
13,997 |
33.90% |
| Turn |
 |
41,295 |
54.32% |
|
|
 |
Mike Gapes
Labour hold
|
| LC |
Mike Gapes |
24,619 |
59.62% |
| UK |
Harun Khan |
1,407 |
3.41% |
| C |
Suresh Kuma |
10,622 |
25.72% |
| LD |
Ralph Scott |
4,647 |
11.25% |
|
Candidates representing 4 parties stood for election to this seat.
|
|
 |
Mike Gapes
Labour gain
|
| Con |
 |
15,073 |
30.13% |
| Lab |
 |
29,273 |
58.52% |
| LD |
 |
3,152 |
6.30% |
| Ref |
 |
1,073 |
2.15% |
| Oth |
 |
1,448 |
2.89% |
| Maj |
 |
14,200 |
28.39% |
| Turn |
 |
50,019 |
69.37% |
|
|
 |
|
Conservative
|
| Con |
 |
24,677 |
46.90% |
| Lab |
 |
22,147 |
42.10% |
| LD |
 |
5,493 |
10.40% |
| Oth |
 |
269 |
0.50% |
| Maj |
 |
2,530 |
4.80% |
| Turn |
 |
52,586 |
76.58% |
|
|
 |
|

|

