|
Inverness East, Nairn & Lochaber
Labour hold

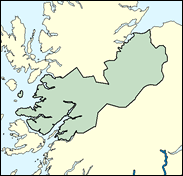
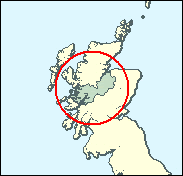
After over 30 years of Liberal representation in the distinctive figure of Sir Russell Johnston, times have moved on in this vast seat, and the main contenders are now Labour, represented by Westminster MP David Stewart, and the SNP, for whom Fergus Ewing, he of a famous Nationalist family, won the seat in the Scottish Parliament elections, by just 441 votes. Another tight Labour - SNP battle may be expected next time, but with Stewart standing again and Ewing presumably not, as all sitting SNP MPs have announced their attention to leave Westminster now they are in Edinburgh, the incumbency factor will work heftily in Labour's favour. Incumbency should not be underestimated here, as though physically huge, this serves to increase the importance of personal contact, the knowledge of local issues and the perception of how to do something about them. Russell Johnston was MP here for 30 years, and the subsequent decline of the Liberal Democrats indicates that it was by no means party loyalty that kept him in. Stewart may be able to benefit from a similar pattern. It requires hard work which must be put in, but others have done this in far northern seats (Maclennan in Caithness, Kennedy in Ross, Wallace in Orkney/Shetland) and notched up decades as members, retiring at the time of their choice. not at the behest of the electors.

David Stewart, elected in 1997, is a local man, born 1956, educated at Inverness High School and Paisley College, who was a social worker with Inverness-based Highland Regional Council. His focus is local, on beef farming, oil-rig construction and EU Objective Funding. A loyalist, he also campaigns on behalf of diabetes. With only a third of the voters electing him in 1997 and the seat lost to the SNP in the 1999 Scottish elections, he is vulnerable to the Nationalist Angus MacNeil, a native Gaelic-speaker, born 1970, educated in Barra and Stornoway in the Western Isles and at Strathclyde University and Jordanhill Teacher Training College - whence to primary school teaching.
 |
| Wealthy Achievers, Suburban Areas |
13.21% |
14.99% |
88.13 |
|
| Affluent Greys, Rural Communities |
15.03% |
2.13% |
706.97 |
|
| Prosperous Pensioners, Retirement Areas |
1.83% |
2.49% |
73.41 |
|
| Affluent Executives, Family Areas |
4.41% |
4.43% |
99.71 |
|
| Well-Off Workers, Family Areas |
9.72% |
7.27% |
133.67 |
|
| Affluent Urbanites, Town & City Areas |
2.06% |
2.56% |
80.45 |
|
| Prosperous Professionals, Metropolitan Areas |
0.30% |
2.04% |
14.72 |
|
| Better-Off Executives, Inner City Areas |
3.40% |
3.94% |
86.28 |
|
| Comfortable Middle Agers, Mature Home Owning Areas |
10.92% |
13.04% |
83.75 |
|
| Skilled Workers, Home Owning Areas |
2.81% |
12.70% |
22.16 |
|
| New Home Owners, Mature Communities |
5.87% |
8.14% |
72.10 |
|
| White Collar Workers, Better-Off Multi Ethnic Areas |
2.73% |
4.02% |
67.91 |
|
| Older People, Less Prosperous Areas |
1.90% |
3.19% |
59.51 |
|
| Council Estate Residents, Better-Off Homes |
20.65% |
11.31% |
182.56 |
|
| Council Estate Residents, High Unemployment |
2.70% |
3.06% |
88.19 |
|
| Council Estate Residents, Greatest Hardship |
2.36% |
2.52% |
93.57 |
|
| People in Multi-Ethnic, Low-Income Areas |
0.00% |
2.10% |
0.00 |
|
| Unclassified |
0.09% |
0.06% |
141.75 |
|
|
 |
 |
 |
| £0-5K |
8.89% |
9.41% |
94.48 |
|
| £5-10K |
17.60% |
16.63% |
105.82 |
|
| £10-15K |
18.15% |
16.58% |
109.48 |
|
| £15-20K |
14.83% |
13.58% |
109.17 |
|
| £20-25K |
11.08% |
10.39% |
106.63 |
|
| £25-30K |
8.00% |
7.77% |
102.90 |
|
| £30-35K |
5.71% |
5.79% |
98.57 |
|
| £35-40K |
4.07% |
4.33% |
94.02 |
|
| £40-45K |
2.92% |
3.27% |
89.48 |
|
| £45-50K |
2.11% |
2.48% |
85.05 |
|
| £50-55K |
1.54% |
1.90% |
80.83 |
|
| £55-60K |
1.13% |
1.47% |
76.84 |
|
| £60-65K |
0.84% |
1.15% |
73.09 |
|
| £65-70K |
0.63% |
0.91% |
69.59 |
|
| £70-75K |
0.48% |
0.72% |
66.32 |
|
| £75-80K |
0.36% |
0.57% |
63.28 |
|
| £80-85K |
0.28% |
0.46% |
60.45 |
|
| £85-90K |
0.22% |
0.37% |
57.81 |
|
| £90-95K |
0.17% |
0.31% |
55.36 |
|
| £95-100K |
0.13% |
0.25% |
53.07 |
|
| £100K + |
0.56% |
1.34% |
41.90 |
|
|
|

|


|
1992-1997
|
1997-2001
|
|
|
|
| Con |
-6.01% |
| Lab |
10.69% |
| LD |
-9.19% |
| SNP |
3.89% |
|
| Con |
-4.18% |
| Lab |
2.86% |
| LD |
4.68% |
| SNP |
-3.35% |
|
|
 |
David Stewart
Labour hold
|
| Con |
 |
5,653 |
13.31% |
| Lab |
 |
15,605 |
36.75% |
| LD |
 |
9,420 |
22.19% |
| SNP |
 |
10,889 |
25.64% |
| Oth |
 |
894 |
2.11% |
| Maj |
 |
4,716 |
11.11% |
| Turn |
 |
42,461 |
63.24% |
|
|
 |
David Stewart
Labour hold
|
| SSP |
Steve Arnott |
894 |
2.11% |
| C |
Richard Jenkins |
5,653 |
13.31% |
| LD |
Patsy Kenton |
9,420 |
22.19% |
| SNP |
Angus MacNeil |
10,889 |
25.64% |
| L |
David Stewart |
15,605 |
36.75% |
|
Candidates representing 5 parties stood for election to this seat.
|
|
 |
David Stewart
Labour gain
|
| Con |
 |
8,355 |
17.49% |
| Lab |
 |
16,187 |
33.89% |
| LD |
 |
8,364 |
17.51% |
| SNP |
 |
13,848 |
28.99% |
| Ref |
 |
436 |
0.91% |
| Oth |
 |
578 |
1.21% |
| Maj |
 |
2,339 |
4.90% |
| Turn |
 |
47,768 |
72.71% |
|
|
 |
|
Liberal Democrat
|
| Con |
 |
10,777 |
23.50% |
| Lab |
 |
10,633 |
23.20% |
| LD |
 |
12,249 |
26.70% |
| SNP |
 |
11,513 |
25.10% |
| Oth |
 |
720 |
1.60% |
| Maj |
 |
736 |
1.60% |
| Turn |
 |
45,892 |
72.48% |
|
|
 |
|

|

