|
Ipswich
Labour hold

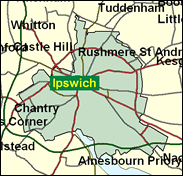
Yet another easy win for Labour in 1997, this historically iconoclastic seat looks safe now for Jamie Cann, a former local deputy headmaster whose career in Ipswich Council goes back as far as 1973. Cann is an individual, producing some quirky but no doubt popular votes on Commons divisions on the age of homosexual consent, for example. The Conservatives pressed Labour close in the voting for that council last time it was contested, in May 2000, but overall Cann does well not to have the four wards syphoned off to Suffolk Central and Ipswich North in his constituency. Labour held Ipswich as a whole continuously from 1938 to 1970, then from October 1974 to 1987, but then lost it to the Tories, who had failed throughout the 1950s and in 1979 and 1983. This suggests that Suffolk's largest and county town elects Labour unless there are exceptional circumstances acting against them, which has hardly been the case in the past decade.

Jamie Cann, a former school teacher and well-regarded leader of Ipswich council, was elected in 1992. Born 1946 and educated at Barton-on-Humber Grammar School and Kesteven College of Education, he was rebellious in Opposition, mostly on Maastricht, but since 1997 his experience of party discipline as a Council leader has shown through with only isolated acts of dissidence over disability benefit cuts. He is however in the small Labour minority that opposes strict gun control and homosexual sex at 16.
 |
| Wealthy Achievers, Suburban Areas |
6.25% |
14.99% |
41.68 |
|
| Affluent Greys, Rural Communities |
0.00% |
2.13% |
0.00 |
|
| Prosperous Pensioners, Retirement Areas |
2.28% |
2.49% |
91.75 |
|
| Affluent Executives, Family Areas |
1.81% |
4.43% |
40.98 |
|
| Well-Off Workers, Family Areas |
7.04% |
7.27% |
96.75 |
|
| Affluent Urbanites, Town & City Areas |
1.39% |
2.56% |
54.26 |
|
| Prosperous Professionals, Metropolitan Areas |
0.15% |
2.04% |
7.21 |
|
| Better-Off Executives, Inner City Areas |
5.24% |
3.94% |
132.89 |
|
| Comfortable Middle Agers, Mature Home Owning Areas |
14.90% |
13.04% |
114.26 |
|
| Skilled Workers, Home Owning Areas |
18.57% |
12.70% |
146.20 |
|
| New Home Owners, Mature Communities |
12.20% |
8.14% |
149.80 |
|
| White Collar Workers, Better-Off Multi Ethnic Areas |
8.57% |
4.02% |
213.01 |
|
| Older People, Less Prosperous Areas |
5.97% |
3.19% |
187.37 |
|
| Council Estate Residents, Better-Off Homes |
10.19% |
11.31% |
90.12 |
|
| Council Estate Residents, High Unemployment |
2.85% |
3.06% |
93.23 |
|
| Council Estate Residents, Greatest Hardship |
2.59% |
2.52% |
102.80 |
|
| People in Multi-Ethnic, Low-Income Areas |
0.00% |
2.10% |
0.00 |
|
| Unclassified |
0.00% |
0.06% |
0.00 |
|
|
 |
 |
 |
| £0-5K |
12.11% |
9.41% |
128.60 |
|
| £5-10K |
20.21% |
16.63% |
121.50 |
|
| £10-15K |
18.79% |
16.58% |
113.34 |
|
| £15-20K |
14.29% |
13.58% |
105.22 |
|
| £20-25K |
10.13% |
10.39% |
97.51 |
|
| £25-30K |
7.03% |
7.77% |
90.38 |
|
| £30-35K |
4.86% |
5.79% |
83.94 |
|
| £35-40K |
3.39% |
4.33% |
78.17 |
|
| £40-45K |
2.39% |
3.27% |
73.05 |
|
| £45-50K |
1.70% |
2.48% |
68.52 |
|
| £50-55K |
1.23% |
1.90% |
64.51 |
|
| £55-60K |
0.90% |
1.47% |
60.96 |
|
| £60-65K |
0.67% |
1.15% |
57.81 |
|
| £65-70K |
0.50% |
0.91% |
55.00 |
|
| £70-75K |
0.38% |
0.72% |
52.49 |
|
| £75-80K |
0.29% |
0.57% |
50.24 |
|
| £80-85K |
0.22% |
0.46% |
48.21 |
|
| £85-90K |
0.17% |
0.37% |
46.38 |
|
| £90-95K |
0.14% |
0.31% |
44.72 |
|
| £95-100K |
0.11% |
0.25% |
43.21 |
|
| £100K + |
0.49% |
1.34% |
36.42 |
|
|
|

|


|
1992-1997
|
1997-2001
|
|
|
|
| Con |
-12.19% |
| Lab |
8.79% |
| LD |
0.76% |
|
| Con |
-0.57% |
| Lab |
-1.37% |
| LD |
3.03% |
|
|
 |
Jamie Cann
Labour hold
|
| Con |
 |
11,871 |
30.54% |
| Lab |
 |
19,952 |
51.33% |
| LD |
 |
5,904 |
15.19% |
| Oth |
 |
1,146 |
2.95% |
| Maj |
 |
8,081 |
20.79% |
| Turn |
 |
38,873 |
57.00% |
|
|
 |
Jamie Cann
Labour hold
|
| L |
Jamie Cann |
19,952 |
51.33% |
| LD |
Terry Gilbert |
5,904 |
15.19% |
| SL |
Shaun Gratton |
217 |
0.56% |
| SA |
Peter Leech |
305 |
0.78% |
| UK |
William Vinyard |
624 |
1.61% |
| C |
Edward Wild |
11,871 |
30.54% |
|
Candidates representing 6 parties stood for election to this seat.
|
|
 |
Jamie Cann
Labour
|
| Con |
 |
15,045 |
31.11% |
| Lab |
 |
25,484 |
52.69% |
| LD |
 |
5,881 |
12.16% |
| Ref |
 |
1,637 |
3.38% |
| Oth |
 |
315 |
0.65% |
| Maj |
 |
10,439 |
21.59% |
| Turn |
 |
48,362 |
72.24% |
|
|
 |
|
Labour
|
| Con |
 |
23,288 |
43.30% |
| Lab |
 |
23,623 |
43.90% |
| LD |
 |
6,135 |
11.40% |
| Oth |
 |
769 |
1.40% |
| Maj |
 |
335 |
0.60% |
| Turn |
 |
53,815 |
78.97% |
|
|
 |
|

|

