|
Isle of Wight
Conservative gain

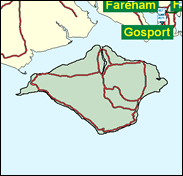
A place of its own mind in many ways, the Isle of Wight is happy to remain the largest (and hence in theory under-represented) constituency in the United Kingdom, and that by a huge margin of more than 20,000 votes. But there is no apparent feeling here that some voters should be un-detached to influence a "mainland" seat, and this has already been agreed by the next Boundary Commission which will recommend seats which will exist until around 2015 (if there is no major reform of the electoral system). The Isle of Wight is also now a unitary local authority, of which the Liberal Democrats failed to take control in 1998, polling almost exactly the same number of votes as the Conservatives and returning a similar number of councillors (there were quite a few (11) independents too). As might perhaps be expected, well over half of the voters who turned out voted for Euro-sceptic parties in June 1999 too, and this individual and huge seat will make a rather unpredictable decision on the future of Lib Dem MP Dr Peter Brand sometime in 2001. It has been known to remove MPs before, most notably Mark Woodnutt in February 1974 after a much longer tenure that Peter Brand, who must hope he has tended his huge electorate effectively.

Dr Peter Brand, Dutch-born in 1947, married to a great-niece of Clement Attlee, and educated at Thornbury Grammar School and Birmingham University, is a local GP and former councillor. In the Liberal Democrat Health team, he raised eyebrows and the distant prospect of his own arrest last year by admitting that like countless doctors he had assisted patients towards their deaths, though presumably not since becoming an MP here.
 |
| Wealthy Achievers, Suburban Areas |
9.56% |
14.99% |
63.74 |
|
| Affluent Greys, Rural Communities |
5.45% |
2.13% |
256.48 |
|
| Prosperous Pensioners, Retirement Areas |
19.44% |
2.49% |
782.08 |
|
| Affluent Executives, Family Areas |
0.32% |
4.43% |
7.14 |
|
| Well-Off Workers, Family Areas |
2.44% |
7.27% |
33.50 |
|
| Affluent Urbanites, Town & City Areas |
0.10% |
2.56% |
3.88 |
|
| Prosperous Professionals, Metropolitan Areas |
0.00% |
2.04% |
0.00 |
|
| Better-Off Executives, Inner City Areas |
3.83% |
3.94% |
97.13 |
|
| Comfortable Middle Agers, Mature Home Owning Areas |
23.96% |
13.04% |
183.75 |
|
| Skilled Workers, Home Owning Areas |
10.90% |
12.70% |
85.78 |
|
| New Home Owners, Mature Communities |
13.15% |
8.14% |
161.51 |
|
| White Collar Workers, Better-Off Multi Ethnic Areas |
3.31% |
4.02% |
82.39 |
|
| Older People, Less Prosperous Areas |
2.33% |
3.19% |
73.18 |
|
| Council Estate Residents, Better-Off Homes |
4.52% |
11.31% |
39.93 |
|
| Council Estate Residents, High Unemployment |
0.67% |
3.06% |
21.96 |
|
| Council Estate Residents, Greatest Hardship |
0.00% |
2.52% |
0.00 |
|
| People in Multi-Ethnic, Low-Income Areas |
0.00% |
2.10% |
0.00 |
|
| Unclassified |
0.02% |
0.06% |
34.88 |
|
|
 |
 |
 |
| £0-5K |
12.70% |
9.41% |
134.87 |
|
| £5-10K |
21.30% |
16.63% |
128.04 |
|
| £10-15K |
19.44% |
16.58% |
117.26 |
|
| £15-20K |
14.38% |
13.58% |
105.88 |
|
| £20-25K |
9.90% |
10.39% |
95.30 |
|
| £25-30K |
6.68% |
7.77% |
85.96 |
|
| £30-35K |
4.51% |
5.79% |
77.88 |
|
| £35-40K |
3.07% |
4.33% |
70.95 |
|
| £40-45K |
2.12% |
3.27% |
65.01 |
|
| £45-50K |
1.49% |
2.48% |
59.91 |
|
| £50-55K |
1.06% |
1.90% |
55.50 |
|
| £55-60K |
0.76% |
1.47% |
51.67 |
|
| £60-65K |
0.56% |
1.15% |
48.34 |
|
| £65-70K |
0.41% |
0.91% |
45.41 |
|
| £70-75K |
0.31% |
0.72% |
42.82 |
|
| £75-80K |
0.23% |
0.57% |
40.53 |
|
| £80-85K |
0.18% |
0.46% |
38.48 |
|
| £85-90K |
0.14% |
0.37% |
36.64 |
|
| £90-95K |
0.11% |
0.31% |
34.99 |
|
| £95-100K |
0.08% |
0.25% |
33.50 |
|
| £100K + |
0.36% |
1.34% |
26.95 |
|
|
|

|


|
1992-1997
|
1997-2001
|
|
|
|
| Con |
-13.91% |
| Lab |
7.18% |
| LD |
-2.85% |
|
| Con |
5.74% |
| Lab |
2.06% |
| LD |
-7.47% |
|
|
 |
Andrew Turner
Conservative gain
|
| Con |
 |
25,223 |
39.73% |
| Lab |
 |
9,676 |
15.24% |
| LD |
 |
22,397 |
35.28% |
| Oth |
 |
6,186 |
9.74% |
| Maj |
 |
2,826 |
4.45% |
| Turn |
 |
63,482 |
59.72% |
|
|
 |
Andrew Turner
Conservative gain
|
| LD |
Peter Brand |
22,397 |
35.28% |
| L |
Deborah Gardiner |
9,676 |
15.24% |
| I |
David Holmes |
1,423 |
2.24% |
| UK |
David Lott |
2,106 |
3.32% |
| IoW |
Paul Murray |
1,164 |
1.83% |
| G |
Paul Scivier |
1,279 |
2.01% |
| SL |
James Spensley |
214 |
0.34% |
| C |
Andrew Turner |
25,223 |
39.73% |
|
Candidates representing 8 parties stood for election to this seat.
|
|
 |
Peter Brand
Liberal Democrat gain
|
| Con |
 |
24,868 |
33.99% |
| Lab |
 |
9,646 |
13.18% |
| LD |
 |
31,274 |
42.75% |
| Ref |
 |
4,734 |
6.47% |
| Oth |
 |
2,637 |
3.60% |
| Maj |
 |
6,406 |
8.76% |
| Turn |
 |
73,159 |
71.95% |
|
|
 |
|
Conservative
|
| Con |
 |
38,163 |
47.90% |
| Lab |
 |
4,784 |
6.00% |
| LD |
 |
36,336 |
45.60% |
| Oth |
 |
350 |
0.40% |
| Maj |
 |
1,827 |
2.30% |
| Turn |
 |
79,633 |
78.24% |
|
|
 |
|

|

