|
Batley & Spen
Labour hold

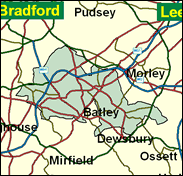
Labour has struggled in the West Yorkshire metropolitan borough of Kirklees in recent years, winning only one of the five wards in this constituency in May 2000 against two in 1999, and it must be regarded as an outside marginal Tory regain in the general election. Labour's overall majority is not in such severe danger of being wiped out as mere statistics suggest, however. Batley and Spen is a classic west Yorkshire marginal, its economy once based heavily on woollen textiles. The Tories have been very competitive in recent general elections: Elizabeth Peacock won in 1987 and 1992, and restricted the pro-Labour swing to unusually low levels in 92 and in 1997, when she did lose. There seems to be something of a long-term anti-Labour trend here, partially disguised by the 1997 landslide, which may have to do with the performance of the local council and also related to a backlash against the demand for separate Muslim education in this part of West Yorkshire. Elizabeth Peacock stands again as Tory candidate, which should help raise spirits at Conservative Central Office .

Labour's Mike Wood is one of a handful of the huge 1997 intake who joined the Campaign Group and rebels regularly, if in his case quietly, against the government. A bearded social worker, born in 1946 and elongatedly educated at Nantwich & Acton Grammar School, Nantwich, Salisbury & Wells Theological College, Leeds University and Leeds Poly, he has kicked over the Blairite traces on lone parent benefit cuts, disability benefits, linking pensions to average earnings, Freedom of Information, and air traffic control sell-off.
 |
| Wealthy Achievers, Suburban Areas |
5.67% |
14.99% |
37.83 |
|
| Affluent Greys, Rural Communities |
0.00% |
2.13% |
0.00 |
|
| Prosperous Pensioners, Retirement Areas |
0.12% |
2.49% |
4.93 |
|
| Affluent Executives, Family Areas |
1.46% |
4.43% |
32.96 |
|
| Well-Off Workers, Family Areas |
14.30% |
7.27% |
196.54 |
|
| Affluent Urbanites, Town & City Areas |
0.20% |
2.56% |
7.98 |
|
| Prosperous Professionals, Metropolitan Areas |
0.00% |
2.04% |
0.00 |
|
| Better-Off Executives, Inner City Areas |
0.00% |
3.94% |
0.00 |
|
| Comfortable Middle Agers, Mature Home Owning Areas |
9.64% |
13.04% |
73.97 |
|
| Skilled Workers, Home Owning Areas |
24.75% |
12.70% |
194.85 |
|
| New Home Owners, Mature Communities |
5.87% |
8.14% |
72.09 |
|
| White Collar Workers, Better-Off Multi Ethnic Areas |
0.07% |
4.02% |
1.75 |
|
| Older People, Less Prosperous Areas |
5.26% |
3.19% |
165.04 |
|
| Council Estate Residents, Better-Off Homes |
22.57% |
11.31% |
199.50 |
|
| Council Estate Residents, High Unemployment |
2.04% |
3.06% |
66.56 |
|
| Council Estate Residents, Greatest Hardship |
1.09% |
2.52% |
43.22 |
|
| People in Multi-Ethnic, Low-Income Areas |
6.92% |
2.10% |
329.39 |
|
| Unclassified |
0.04% |
0.06% |
68.65 |
|
|
 |
 |
 |
| £0-5K |
10.42% |
9.41% |
110.64 |
|
| £5-10K |
17.96% |
16.63% |
107.99 |
|
| £10-15K |
17.63% |
16.58% |
106.34 |
|
| £15-20K |
14.15% |
13.58% |
104.14 |
|
| £20-25K |
10.54% |
10.39% |
101.39 |
|
| £25-30K |
7.64% |
7.77% |
98.34 |
|
| £30-35K |
5.51% |
5.79% |
95.18 |
|
| £35-40K |
3.99% |
4.33% |
92.06 |
|
| £40-45K |
2.91% |
3.27% |
89.06 |
|
| £45-50K |
2.14% |
2.48% |
86.22 |
|
| £50-55K |
1.59% |
1.90% |
83.54 |
|
| £55-60K |
1.19% |
1.47% |
81.04 |
|
| £60-65K |
0.91% |
1.15% |
78.70 |
|
| £65-70K |
0.69% |
0.91% |
76.51 |
|
| £70-75K |
0.54% |
0.72% |
74.47 |
|
| £75-80K |
0.42% |
0.57% |
72.56 |
|
| £80-85K |
0.33% |
0.46% |
70.76 |
|
| £85-90K |
0.26% |
0.37% |
69.08 |
|
| £90-95K |
0.21% |
0.31% |
67.50 |
|
| £95-100K |
0.17% |
0.25% |
66.02 |
|
| £100K + |
0.78% |
1.34% |
58.24 |
|
|
|

|


|
1992-1997
|
1997-2001
|
|
|
|
| Con |
-8.35% |
| Lab |
6.43% |
| LD |
-2.50% |
|
| Con |
0.39% |
| Lab |
0.45% |
| LD |
1.55% |
|
|
 |
Mike Wood
Labour hold
|
| Con |
 |
14,160 |
36.74% |
| Lab |
 |
19,224 |
49.88% |
| LD |
 |
3,989 |
10.35% |
| Oth |
 |
1,169 |
3.03% |
| Maj |
 |
5,064 |
13.14% |
| Turn |
 |
38,542 |
60.54% |
|
|
 |
Mike Wood
Labour hold
|
| UK |
Allen Burton |
574 |
1.49% |
| G |
Clive Lord |
595 |
1.54% |
| C |
Elizabeth Peacock |
14,160 |
36.74% |
| LD |
Kath Pinnock |
3,989 |
10.35% |
| L |
Mike Wood |
19,224 |
49.88% |
|
Candidates representing 5 parties stood for election to this seat.
|
|
 |
Mike Wood
Labour gain
|
| Con |
 |
17,072 |
36.35% |
| Lab |
 |
23,213 |
49.43% |
| LD |
 |
4,133 |
8.80% |
| Ref |
 |
1,691 |
3.60% |
| Oth |
 |
856 |
1.82% |
| Maj |
 |
6,141 |
13.08% |
| Turn |
 |
46,965 |
73.14% |
|
|
 |
|
Conservative
|
| Con |
 |
22,676 |
44.70% |
| Lab |
 |
21,831 |
43.00% |
| LD |
 |
5,757 |
11.30% |
| Oth |
 |
520 |
1.00% |
| Maj |
 |
845 |
1.70% |
| Turn |
 |
50,784 |
78.43% |
|
|
 |
|

|

