|
Islington North
Labour hold

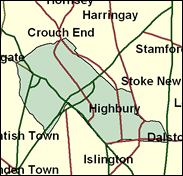
Although a safe Labour seat now, Islington North has in the last 20 years had a colourful history involving Labour defectors Michael O'Halloran and John Grant (of the former Central seat, abolished in 1983 and partly merged with North). In 1983 these two actually managed to stand against each other, O'Halloran as an Independent, Grant as official SDP, which allowed the Left winger Jeremy Corbyn to beat both and start his tenure here, which is now very strong. Corbyn is as far removed from Tony Blair's image of the New Labour party as can be found in Parliament, but his seat is rather suitable for him. It has deprived sections, with high proportions of council housing (more than 40pc) and non-white voters, (22pc in 1991), as well as a large and prominent Irish influence. The very high number of middle class professionals who are to be found here as well (44pc are in professional or managerial occupations and nearly 65pc in all, including these, are non-manual workers), are the sort of people who are clearly not only Labour supporters (Corbyn got nearly 70pc of the Islington North vote in 1997) but also willing to send a socialist to the Commons.

Jeremy Corbyn, MP here since 1983, was the third most rebellious Labour MP in the 1992 to 1997 Parliament and has deliberately missed none of the rebellions against the Blair government since 1997. A completely unreconstructed hard leftwinger of compelling earnestness, in the manner of a tortured Christ, his politics when not red are green - in two senses: as an apologist for any expression of radical Irish republicanism, and as a keen environmentalist.He is a former NUPE official, born 1949 and educated at Adams Grammar School, Newport (Shropshire) and (inconclusively) at North London Polytechnic. What is lacking in humour is made up for in intensity, in a life so absorbed by politics that he and his wife parted over the selective education of one of their children.
 |
| Wealthy Achievers, Suburban Areas |
0.01% |
14.99% |
0.08 |
|
| Affluent Greys, Rural Communities |
0.00% |
2.13% |
0.00 |
|
| Prosperous Pensioners, Retirement Areas |
0.07% |
2.49% |
2.73 |
|
| Affluent Executives, Family Areas |
0.00% |
4.43% |
0.00 |
|
| Well-Off Workers, Family Areas |
0.00% |
7.27% |
0.00 |
|
| Affluent Urbanites, Town & City Areas |
1.75% |
2.56% |
68.22 |
|
| Prosperous Professionals, Metropolitan Areas |
16.09% |
2.04% |
788.27 |
|
| Better-Off Executives, Inner City Areas |
43.84% |
3.94% |
1,111.65 |
|
| Comfortable Middle Agers, Mature Home Owning Areas |
0.04% |
13.04% |
0.28 |
|
| Skilled Workers, Home Owning Areas |
0.00% |
12.70% |
0.00 |
|
| New Home Owners, Mature Communities |
0.00% |
8.14% |
0.00 |
|
| White Collar Workers, Better-Off Multi Ethnic Areas |
2.26% |
4.02% |
56.32 |
|
| Older People, Less Prosperous Areas |
0.00% |
3.19% |
0.00 |
|
| Council Estate Residents, Better-Off Homes |
0.00% |
11.31% |
0.00 |
|
| Council Estate Residents, High Unemployment |
14.27% |
3.06% |
466.11 |
|
| Council Estate Residents, Greatest Hardship |
0.00% |
2.52% |
0.00 |
|
| People in Multi-Ethnic, Low-Income Areas |
21.67% |
2.10% |
1,031.81 |
|
| Unclassified |
0.00% |
0.06% |
0.00 |
|
|
 |
 |
 |
| £0-5K |
7.90% |
9.41% |
83.96 |
|
| £5-10K |
12.87% |
16.63% |
77.39 |
|
| £10-15K |
13.58% |
16.58% |
81.91 |
|
| £15-20K |
12.10% |
13.58% |
89.07 |
|
| £20-25K |
10.08% |
10.39% |
96.99 |
|
| £25-30K |
8.17% |
7.77% |
105.03 |
|
| £30-35K |
6.54% |
5.79% |
112.91 |
|
| £35-40K |
5.22% |
4.33% |
120.55 |
|
| £40-45K |
4.18% |
3.27% |
127.91 |
|
| £45-50K |
3.35% |
2.48% |
135.00 |
|
| £50-55K |
2.70% |
1.90% |
141.81 |
|
| £55-60K |
2.19% |
1.47% |
148.39 |
|
| £60-65K |
1.78% |
1.15% |
154.74 |
|
| £65-70K |
1.46% |
0.91% |
160.88 |
|
| £70-75K |
1.20% |
0.72% |
166.85 |
|
| £75-80K |
0.99% |
0.57% |
172.65 |
|
| £80-85K |
0.82% |
0.46% |
178.29 |
|
| £85-90K |
0.69% |
0.37% |
183.80 |
|
| £90-95K |
0.58% |
0.31% |
189.18 |
|
| £95-100K |
0.49% |
0.25% |
194.44 |
|
| £100K + |
3.08% |
1.34% |
228.91 |
|
|
|

|


|
1992-1997
|
1997-2001
|
|
|
|
| Con |
-10.79% |
| Lab |
11.85% |
| LD |
-1.49% |
|
| Con |
-2.16% |
| Lab |
-7.37% |
| LD |
5.39% |
|
|
 |
Jeremy Corbyn
Labour hold
|
| Con |
 |
3,249 |
10.75% |
| Lab |
 |
18,699 |
61.88% |
| LD |
 |
5,741 |
19.00% |
| Oth |
 |
2,527 |
8.36% |
| Maj |
 |
12,958 |
42.88% |
| Turn |
 |
30,216 |
48.76% |
|
|
 |
Jeremy Corbyn
Labour hold
|
| G |
Chris Ashby |
1,876 |
6.21% |
| SL |
Steve Cook |
512 |
1.69% |
| L |
Jeremy Corbyn |
18,699 |
61.88% |
| Reform |
Emine Hassan |
139 |
0.46% |
| C |
Neil Rands |
3,249 |
10.75% |
| LD |
Laura Willoughby |
5,741 |
19.00% |
|
Candidates representing 6 parties stood for election to this seat.
|
|
 |
Jeremy Corbyn
Labour
|
| Con |
 |
4,631 |
12.91% |
| Lab |
 |
24,834 |
69.25% |
| LD |
 |
4,879 |
13.61% |
| Ref |
|
0 |
0.00% |
| Oth |
 |
1,516 |
4.23% |
| Maj |
 |
19,955 |
55.65% |
| Turn |
 |
35,860 |
62.49% |
|
|
 |
|
Labour
|
| Con |
 |
8,958 |
23.70% |
| Lab |
 |
21,742 |
57.40% |
| LD |
 |
5,732 |
15.10% |
| Oth |
 |
1,420 |
3.80% |
| Maj |
 |
12,784 |
33.80% |
| Turn |
 |
37,852 |
68.02% |
|
|
 |
|

|

