|
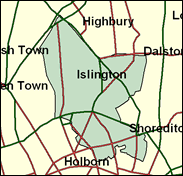
Islington South & Finsbury
Labour hold

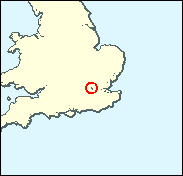
Islington has a reputation for trendy middle class residency, of which Tony Blair is an epitome, having very visibly taken his motorcade from Richmond Crescent, his family home in Barnsbury, to Downing Street on the morning of 2 May 1997. Canonbury, Barnsbury, Upper Street, Clerkenwell; it is difficult to keep up with which neighbourhood is fashionable at the moment, if you are not part of the set with access to the information regarded as worth having. It seems entirely appropriate that the MP here, with a majority requiring a swing of more than 20pc to beat him, is Chris Smith, the Culture Secretary. Yet this stereotype of Islington is far from entirely accurate. There are many old-fashioned, non trendy and proud of it residents and neighbourhoods here. Some wards have high proportions of council tenants - it should be remembered that a majority, more than 55pc, one of the highest figures in London and 14th highest in Britain live in council housing. There are non-white communities in wards like Tollington, but also council estates which are inner city but almost all white, as in Bunhill and Clerkenwell in the far south, and Canonbury wards (both East and West), which do not approve of New Labour or Old Labour and vote Liberal Democrat in Islington borough elections, but perhaps not because they support national LD policies. Islington borough as a whole is slightly less non-white than the Greater London 1991 average, at 18%. It should not be forgotten that Smith did not have an easy ride in Islington South in his first two contests in 1983 and 1987, his majority staying in three figures. This seat is not to be taken for granted, or categorised, lightly.

Chris Smith, a Labour politician with a doctorate on Wordsworth, was elected in 1983 in a seat made marginal by George Cunningham's defection to the SDP. Born 1951 and educated at George Watson's College, Edinburgh and Pembroke College, Cambridge, he was given the job of Culture Secretary in 1997, before which he was best known as the first self-confessed homosexual MP until 1997 when more followed suit. His stint as Culture Secretary has been long enough for him to earn brickbats from the chattering arts and media establishment, many members of which inhabit his modish constituency.
 |
| Wealthy Achievers, Suburban Areas |
0.06% |
14.99% |
0.37 |
|
| Affluent Greys, Rural Communities |
0.00% |
2.13% |
0.00 |
|
| Prosperous Pensioners, Retirement Areas |
0.06% |
2.49% |
2.49 |
|
| Affluent Executives, Family Areas |
0.00% |
4.43% |
0.00 |
|
| Well-Off Workers, Family Areas |
0.00% |
7.27% |
0.00 |
|
| Affluent Urbanites, Town & City Areas |
2.29% |
2.56% |
89.25 |
|
| Prosperous Professionals, Metropolitan Areas |
11.05% |
2.04% |
541.24 |
|
| Better-Off Executives, Inner City Areas |
26.89% |
3.94% |
681.91 |
|
| Comfortable Middle Agers, Mature Home Owning Areas |
0.07% |
13.04% |
0.54 |
|
| Skilled Workers, Home Owning Areas |
0.03% |
12.70% |
0.21 |
|
| New Home Owners, Mature Communities |
0.00% |
8.14% |
0.00 |
|
| White Collar Workers, Better-Off Multi Ethnic Areas |
3.04% |
4.02% |
75.60 |
|
| Older People, Less Prosperous Areas |
0.01% |
3.19% |
0.40 |
|
| Council Estate Residents, Better-Off Homes |
0.00% |
11.31% |
0.00 |
|
| Council Estate Residents, High Unemployment |
37.28% |
3.06% |
1,217.58 |
|
| Council Estate Residents, Greatest Hardship |
0.00% |
2.52% |
0.00 |
|
| People in Multi-Ethnic, Low-Income Areas |
19.12% |
2.10% |
910.72 |
|
| Unclassified |
0.10% |
0.06% |
152.53 |
|
|
 |
|
|
| £0-5K |
7.26% |
9.41% |
77.12 |
|
| £5-10K |
12.34% |
16.63% |
74.22 |
|
| £10-15K |
13.31% |
16.58% |
80.26 |
|
| £15-20K |
12.01% |
13.58% |
88.44 |
|
| £20-25K |
10.09% |
10.39% |
97.09 |
|
| £25-30K |
8.21% |
7.77% |
105.64 |
|
| £30-35K |
6.59% |
5.79% |
113.85 |
|
| £35-40K |
5.27% |
4.33% |
121.65 |
|
| £40-45K |
4.21% |
3.27% |
129.04 |
|
| £45-50K |
3.38% |
2.48% |
136.02 |
|
| £50-55K |
2.72% |
1.90% |
142.63 |
|
| £55-60K |
2.20% |
1.47% |
148.91 |
|
| £60-65K |
1.78% |
1.15% |
154.89 |
|
| £65-70K |
1.46% |
0.91% |
160.61 |
|
| £70-75K |
1.19% |
0.72% |
166.09 |
|
| £75-80K |
0.98% |
0.57% |
171.36 |
|
| £80-85K |
0.82% |
0.46% |
176.44 |
|
| £85-90K |
0.68% |
0.37% |
181.36 |
|
| £90-95K |
0.57% |
0.31% |
186.12 |
|
| £95-100K |
0.48% |
0.25% |
190.74 |
|
| £100K + |
2.96% |
1.34% |
220.17 |
|
|
|
|


|
1992-1997
|
1997-2001
|
|
|
|
| Con |
-11.71% |
| Lab |
11.32% |
| LD |
-1.92% |
|
| Con |
0.70% |
| Lab |
-8.57% |
| LD |
6.86% |
|
|
|
Chris Smith
Labour hold
|
| Con |
 |
3,860 |
13.69% |
| Lab |
 |
15,217 |
53.95% |
| LD |
 |
7,937 |
28.14% |
| Oth |
 |
1,192 |
4.23% |
| Maj |
 |
7,280 |
25.81% |
| Turn |
|
28,206 |
47.39% |
|
|
|
Chris Smith
Labour hold
|
| SA |
Janine Booth |
817 |
2.90% |
| I |
Thomas McCarthy |
267 |
0.95% |
| C |
Nicky Morgan |
3,860 |
13.69% |
| LD |
Keith Sharp |
7,937 |
28.14% |
| L |
Chris Smith |
15,217 |
53.95% |
| St |
Charles Thomson |
108 |
0.38% |
|
Candidates representing 6 parties stood for election to this seat.
|
|
|
Chris Smith
Labour
|
| Con |
|
4,587 |
12.99% |
| Lab |
|
22,079 |
62.52% |
| LD |
|
7,516 |
21.28% |
| Ref |
 |
741 |
2.10% |
| Oth |
|
393 |
1.11% |
| Maj |
|
14,563 |
41.24% |
| Turn |
|
35,316 |
63.67% |
|
|
|
|
Labour
|
| Con |
|
9,818 |
24.70% |
| Lab |
|
20,369 |
51.20% |
| LD |
|
9,232 |
23.20% |
| Oth |
|
369 |
0.90% |
| Maj |
|
10,551 |
26.50% |
| Turn |
|
39,788 |
73.08% |
|
|
|
|
|