|
Islwyn
Labour hold

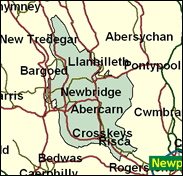
Neil Kinnock's former seat shocked Labour in the Welsh Assembly elections in May 1999 by electing a Plaid Cymru member, Brian Hancock, over their own Shane Williams, by 600 votes. The Nationalists had never historically done well in the South Welsh industrial valleys, or among English speakers (97pc here), and in the 1997 General Election Don Touhig had obtained a truly massive 74pc of the vote (to the sixpc for PC in fourth place), making this safe seat no.8 in the whole of Britain. The extraordinarily aberrant result in 1999 must be put down to disenchantment with the way Labour's leaders conducted the Assembly campaign, and the peripheral powers and importance of the body (turnout 47pc) rather than a gigantic sea change in basic party - and philosophical - allegiance.

Don Touhig, a Labour Whip and one of the Blair government's loyal foot-soldiers who was sacked-but-swiftly-reappointed for leaking a social security committee report to his boss Chancellor Gordon Brown, was elected in succession to Neil Kinnock in 1995. A small man of Irish jockey build, he is one of three Welsh-Irish Catholics representing seats for Labour in Monmouthshire, an area where once the culture was uniformly that of Welsh Nonconformity. A miner's son, born 1947 and educated at St. Francis (RC) School, Pontypool, and East Monmouthshire College, he was a print manager and journalist. An instigator of legislation to protect 'whistleblowers' from victimisation, he backed Millbank's big battalions to ensure Alun Michael, not Rhodri Morgan became Wales' First Minister.
 |
| Wealthy Achievers, Suburban Areas |
1.01% |
14.99% |
6.77 |
|
| Affluent Greys, Rural Communities |
0.00% |
2.13% |
0.00 |
|
| Prosperous Pensioners, Retirement Areas |
0.00% |
2.49% |
0.00 |
|
| Affluent Executives, Family Areas |
0.92% |
4.43% |
20.85 |
|
| Well-Off Workers, Family Areas |
7.78% |
7.27% |
106.97 |
|
| Affluent Urbanites, Town & City Areas |
0.00% |
2.56% |
0.00 |
|
| Prosperous Professionals, Metropolitan Areas |
0.00% |
2.04% |
0.00 |
|
| Better-Off Executives, Inner City Areas |
0.00% |
3.94% |
0.00 |
|
| Comfortable Middle Agers, Mature Home Owning Areas |
3.51% |
13.04% |
26.94 |
|
| Skilled Workers, Home Owning Areas |
45.27% |
12.70% |
356.36 |
|
| New Home Owners, Mature Communities |
24.47% |
8.14% |
300.45 |
|
| White Collar Workers, Better-Off Multi Ethnic Areas |
0.00% |
4.02% |
0.00 |
|
| Older People, Less Prosperous Areas |
3.03% |
3.19% |
95.04 |
|
| Council Estate Residents, Better-Off Homes |
12.66% |
11.31% |
111.90 |
|
| Council Estate Residents, High Unemployment |
0.00% |
3.06% |
0.00 |
|
| Council Estate Residents, Greatest Hardship |
1.35% |
2.52% |
53.62 |
|
| People in Multi-Ethnic, Low-Income Areas |
0.00% |
2.10% |
0.00 |
|
| Unclassified |
0.00% |
0.06% |
0.00 |
|
|
 |
 |
 |
| £0-5K |
10.48% |
9.41% |
111.33 |
|
| £5-10K |
19.60% |
16.63% |
117.82 |
|
| £10-15K |
19.22% |
16.58% |
115.94 |
|
| £15-20K |
14.96% |
13.58% |
110.15 |
|
| £20-25K |
10.66% |
10.39% |
102.61 |
|
| £25-30K |
7.35% |
7.77% |
94.54 |
|
| £30-35K |
5.02% |
5.79% |
86.61 |
|
| £35-40K |
3.43% |
4.33% |
79.17 |
|
| £40-45K |
2.36% |
3.27% |
72.36 |
|
| £45-50K |
1.64% |
2.48% |
66.21 |
|
| £50-55K |
1.16% |
1.90% |
60.71 |
|
| £55-60K |
0.82% |
1.47% |
55.81 |
|
| £60-65K |
0.59% |
1.15% |
51.45 |
|
| £65-70K |
0.43% |
0.91% |
47.57 |
|
| £70-75K |
0.32% |
0.72% |
44.12 |
|
| £75-80K |
0.24% |
0.57% |
41.04 |
|
| £80-85K |
0.18% |
0.46% |
38.28 |
|
| £85-90K |
0.13% |
0.37% |
35.82 |
|
| £90-95K |
0.10% |
0.31% |
33.60 |
|
| £95-100K |
0.08% |
0.25% |
31.61 |
|
| £100K + |
0.31% |
1.34% |
23.18 |
|
|
|

|


|
1992-1997
|
1997-2001
|
|
|
|
| Con |
-7.03% |
| Lab |
-0.15% |
| LD |
2.72% |
| PC |
2.34% |
|
| Con |
0.16% |
| Lab |
-12.61% |
| LD |
4.82% |
| PC |
5.65% |
|
|
 |
Don Touhig
Labour hold
|
| Con |
 |
2,543 |
8.02% |
| Lab |
 |
19,505 |
61.55% |
| LD |
 |
4,196 |
13.24% |
| PC |
 |
3,767 |
11.89% |
| Oth |
 |
1,680 |
5.30% |
| Maj |
 |
15,309 |
48.31% |
| Turn |
 |
31,691 |
61.86% |
|
|
 |
Don Touhig
Labour hold
|
| LD |
Kevin Etheridge |
4,196 |
13.24% |
| C |
Philip Howells |
2,543 |
8.02% |
| SL |
Mary Millington |
417 |
1.32% |
| I |
Paul Taylor |
1,263 |
3.99% |
| PC |
Leigh Thomas |
3,767 |
11.89% |
| LC |
Don Touhig |
19,505 |
61.55% |
|
Candidates representing 6 parties stood for election to this seat.
|
|
 |
Don Touhig
Labour
|
| Con |
 |
2,864 |
7.87% |
| Lab |
 |
26,995 |
74.15% |
| LD |
 |
3,064 |
8.42% |
| PC |
 |
2,272 |
6.24% |
| Ref |
 |
1,209 |
3.32% |
| Oth |
|
0 |
0.00% |
| Maj |
 |
23,931 |
65.74% |
| Turn |
 |
36,404 |
72.03% |
|
|
 |
|
Labour
|
| Con |
 |
6,180 |
14.90% |
| Lab |
 |
30,908 |
74.30% |
| LD |
 |
2,352 |
5.70% |
| PC |
 |
1,606 |
3.90% |
| Oth |
 |
547 |
1.30% |
| Maj |
 |
24,728 |
59.50% |
| Turn |
 |
41,593 |
80.10% |
|
|
 |
|

|

