|
Jarrow
Labour hold

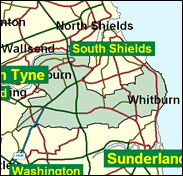
The only constituency to begin with a J, and a famous name in political history, as the South Tyneside town will forever be associated with the "hunger march" to London of 1936, protesting against massive unemployment caused by the great Depression, particularly in the shipbuilding industry. At least it was still remembered in 2000, when lorry drivers staged what can only be described as a very pale and heavily vehicularized imitation. Male unemployment reached 70pc in Jarrow and its neighbour, Hebburn, in the 1930s, far higher than ever since, and the constituncy has of course modernised and diversified its economy. It is still solidly Labour, though, returning Stephen Hepburn with a 22,000 majority in 1997, although his personal increase in share of vote was very low compared with almost everywhere else, mainly because a local independent Labour candidate polled more than 2,500 votes and saved his deposit. This seat, it should be noted, was the constituency of the first Labour woman cabinet minister, Ellen Wilkinson.

Stephen Hepburn, a building-worker-turned-local-MP's-researcher, followed his employer, Don Dixon, here as MP in 1997, having served on the local council for twelve years and obtained a conviction for assaulting a fellow councillor in 1995, in a row between Jarrow and South Shields factions on South Tyneside Council. He has done little to trouble the scorers since, tabling three written questions in his first year.
 |
| Wealthy Achievers, Suburban Areas |
9.73% |
14.99% |
64.88 |
|
| Affluent Greys, Rural Communities |
0.02% |
2.13% |
1.10 |
|
| Prosperous Pensioners, Retirement Areas |
0.00% |
2.49% |
0.00 |
|
| Affluent Executives, Family Areas |
3.15% |
4.43% |
71.21 |
|
| Well-Off Workers, Family Areas |
8.96% |
7.27% |
123.22 |
|
| Affluent Urbanites, Town & City Areas |
1.29% |
2.56% |
50.17 |
|
| Prosperous Professionals, Metropolitan Areas |
0.06% |
2.04% |
2.83 |
|
| Better-Off Executives, Inner City Areas |
0.00% |
3.94% |
0.00 |
|
| Comfortable Middle Agers, Mature Home Owning Areas |
5.64% |
13.04% |
43.23 |
|
| Skilled Workers, Home Owning Areas |
10.42% |
12.70% |
82.07 |
|
| New Home Owners, Mature Communities |
18.39% |
8.14% |
225.84 |
|
| White Collar Workers, Better-Off Multi Ethnic Areas |
0.24% |
4.02% |
5.93 |
|
| Older People, Less Prosperous Areas |
8.48% |
3.19% |
266.35 |
|
| Council Estate Residents, Better-Off Homes |
24.87% |
11.31% |
219.88 |
|
| Council Estate Residents, High Unemployment |
1.91% |
3.06% |
62.37 |
|
| Council Estate Residents, Greatest Hardship |
6.82% |
2.52% |
270.72 |
|
| People in Multi-Ethnic, Low-Income Areas |
0.00% |
2.10% |
0.00 |
|
| Unclassified |
0.02% |
0.06% |
27.60 |
|
|
 |
 |
 |
| £0-5K |
13.38% |
9.41% |
142.12 |
|
| £5-10K |
20.73% |
16.63% |
124.66 |
|
| £10-15K |
18.35% |
16.58% |
110.67 |
|
| £15-20K |
13.63% |
13.58% |
100.32 |
|
| £20-25K |
9.60% |
10.39% |
92.41 |
|
| £25-30K |
6.69% |
7.77% |
86.06 |
|
| £30-35K |
4.68% |
5.79% |
80.79 |
|
| £35-40K |
3.31% |
4.33% |
76.29 |
|
| £40-45K |
2.36% |
3.27% |
72.42 |
|
| £45-50K |
1.71% |
2.48% |
69.05 |
|
| £50-55K |
1.26% |
1.90% |
66.11 |
|
| £55-60K |
0.94% |
1.47% |
63.54 |
|
| £60-65K |
0.71% |
1.15% |
61.29 |
|
| £65-70K |
0.54% |
0.91% |
59.31 |
|
| £70-75K |
0.41% |
0.72% |
57.56 |
|
| £75-80K |
0.32% |
0.57% |
56.01 |
|
| £80-85K |
0.25% |
0.46% |
54.65 |
|
| £85-90K |
0.20% |
0.37% |
53.43 |
|
| £90-95K |
0.16% |
0.31% |
52.34 |
|
| £95-100K |
0.13% |
0.25% |
51.37 |
|
| £100K + |
0.63% |
1.34% |
47.24 |
|
|
|

|


|
1992-1997
|
1997-2001
|
|
|
|
| Con |
-8.46% |
| Lab |
2.35% |
| LD |
-3.03% |
|
| Con |
-0.27% |
| Lab |
1.21% |
| LD |
3.96% |
|
|
 |
Stephen Hepburn
Labour hold
|
| Con |
 |
5,056 |
14.66% |
| Lab |
 |
22,777 |
66.06% |
| LD |
 |
5,182 |
15.03% |
| Oth |
 |
1,464 |
4.25% |
| Maj |
 |
17,595 |
51.03% |
| Turn |
 |
34,479 |
54.58% |
|
|
 |
Stephen Hepburn
Labour hold
|
| UK |
Alan Badger |
716 |
2.08% |
| S |
John Bissett |
357 |
1.04% |
| L |
Stephen Hepburn |
22,777 |
66.06% |
| I |
Alan Le Blonde |
391 |
1.13% |
| LD |
James Selby |
5,182 |
15.03% |
| C |
Donald Wood |
5,056 |
14.66% |
|
Candidates representing 6 parties stood for election to this seat.
|
|
 |
Stephen Hepburn
Labour
|
| Con |
 |
6,564 |
14.94% |
| Lab |
 |
28,497 |
64.85% |
| LD |
 |
4,865 |
11.07% |
| Ref |
 |
1,034 |
2.35% |
| Oth |
 |
2,982 |
6.79% |
| Maj |
 |
21,933 |
49.91% |
| Turn |
 |
43,942 |
68.84% |
|
|
 |
|
Labour
|
| Con |
 |
11,243 |
23.40% |
| Lab |
 |
29,978 |
62.50% |
| LD |
 |
6,749 |
14.10% |
| Oth |
|
0 |
0.00% |
| Maj |
 |
18,735 |
39.10% |
| Turn |
 |
47,970 |
73.15% |
|
|
 |
|

|

