|
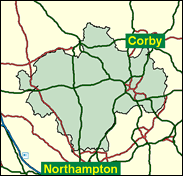
Kettering
Labour hold

One of three super-close Labour gains in Northamptonshire in 1997, the Conservatives must surely realise that if they cannot win Kettering they will come no closer to government than after their their abysmal showing then; indeed Labour can afford to lose Kettering, like Northampton South and Wellingborough, with barely a dent in their hegemony. Yet opinion poll eveidence, and local election results in Kettering Borough, suggest the strong possibility of another close result here - in May 1999, Labour won the most seats on the council, although not the most votes. However, in the Euro elections of 1999 the Conservative list polled 18pc more than Labour here, a bigger lead than in their other Northamptonshire targets. If they recover even a few seats, this should be one of them. This is not really good news for the Conservatives, though, for it is national office that must be their main aim.

Phil Sawford, centre-parted hair, periodic stooge questioner, Campaign Grouper, is Labour's most marginally elected MP. Local-born (1950) and educated (Kettering Grammar School) and then eventually in Ruskin College, reaching Leicester University in his early thirties (to read sociology), he is a former Corby steel-worker who became manager of a training organisation dealing mainly with the unemployed. Despite a low profile, he is one of the few MPs of the 1997 intake to emerge as a fairly frequent rebel - on pensions, Lords reform and air traffic control privatisation. He joined the Campaign Group by 1999, one of only 10 of the 183-strong 1997 intake to do so - a plucky way of insuring against almost certain defeat. His expected Tory nemesis comes in the shape of Londoner Philip Hollobone, a public school (Dulwich) and Oxford (LMH)-educated Eurosceptic with business interests in the privatised water and electricity industries.
 |
| Wealthy Achievers, Suburban Areas |
25.25% |
14.99% |
168.43 |
|
| Affluent Greys, Rural Communities |
0.45% |
2.13% |
21.04 |
|
| Prosperous Pensioners, Retirement Areas |
0.22% |
2.49% |
9.02 |
|
| Affluent Executives, Family Areas |
5.93% |
4.43% |
133.95 |
|
| Well-Off Workers, Family Areas |
13.90% |
7.27% |
191.08 |
|
| Affluent Urbanites, Town & City Areas |
0.00% |
2.56% |
0.00 |
|
| Prosperous Professionals, Metropolitan Areas |
0.00% |
2.04% |
0.00 |
|
| Better-Off Executives, Inner City Areas |
0.35% |
3.94% |
8.91 |
|
| Comfortable Middle Agers, Mature Home Owning Areas |
15.71% |
13.04% |
120.46 |
|
| Skilled Workers, Home Owning Areas |
20.10% |
12.70% |
158.22 |
|
| New Home Owners, Mature Communities |
6.76% |
8.14% |
83.02 |
|
| White Collar Workers, Better-Off Multi Ethnic Areas |
1.92% |
4.02% |
47.84 |
|
| Older People, Less Prosperous Areas |
2.52% |
3.19% |
78.95 |
|
| Council Estate Residents, Better-Off Homes |
4.47% |
11.31% |
39.52 |
|
| Council Estate Residents, High Unemployment |
1.79% |
3.06% |
58.53 |
|
| Council Estate Residents, Greatest Hardship |
0.63% |
2.52% |
25.12 |
|
| People in Multi-Ethnic, Low-Income Areas |
0.00% |
2.10% |
0.00 |
|
| Unclassified |
0.00% |
0.06% |
0.00 |
|
|
 |
|
|
| £0-5K |
8.35% |
9.41% |
88.68 |
|
| £5-10K |
15.89% |
16.63% |
95.53 |
|
| £10-15K |
16.63% |
16.58% |
100.29 |
|
| £15-20K |
13.94% |
13.58% |
102.63 |
|
| £20-25K |
10.76% |
10.39% |
103.53 |
|
| £25-30K |
8.06% |
7.77% |
103.69 |
|
| £30-35K |
6.00% |
5.79% |
103.51 |
|
| £35-40K |
4.47% |
4.33% |
103.18 |
|
| £40-45K |
3.36% |
3.27% |
102.81 |
|
| £45-50K |
2.54% |
2.48% |
102.45 |
|
| £50-55K |
1.95% |
1.90% |
102.14 |
|
| £55-60K |
1.50% |
1.47% |
101.87 |
|
| £60-65K |
1.17% |
1.15% |
101.65 |
|
| £65-70K |
0.92% |
0.91% |
101.49 |
|
| £70-75K |
0.73% |
0.72% |
101.38 |
|
| £75-80K |
0.58% |
0.57% |
101.31 |
|
| £80-85K |
0.47% |
0.46% |
101.28 |
|
| £85-90K |
0.38% |
0.37% |
101.29 |
|
| £90-95K |
0.31% |
0.31% |
101.34 |
|
| £95-100K |
0.25% |
0.25% |
101.41 |
|
| £100K + |
1.38% |
1.34% |
102.82 |
|
|
|
|


|
1992-1997
|
1997-2001
|
|
|
|
| Con |
-9.75% |
| Lab |
11.38% |
| LD |
-4.69% |
|
| Con |
0.53% |
| Lab |
1.43% |
| LD |
-0.53% |
|
|
|
Philip Sawford
Labour hold
|
| Con |
 |
23,369 |
43.48% |
| Lab |
 |
24,034 |
44.71% |
| LD |
 |
5,469 |
10.17% |
| Oth |
 |
880 |
1.64% |
| Maj |
 |
665 |
1.24% |
| Turn |
|
53,752 |
67.45% |
|
|
|
Philip Sawford
Labour hold
|
| LD |
Roger Aron |
5,469 |
10.17% |
| C |
Philip Hollobone |
23,369 |
43.48% |
| UK |
Barry Mahoney |
880 |
1.64% |
| L |
Philip Sawford |
24,034 |
44.71% |
|
Candidates representing 4 parties stood for election to this seat.
|
|
|
Philip Saford
Labour gain
|
| Con |
|
24,461 |
42.95% |
| Lab |
|
24,650 |
43.28% |
| LD |
|
6,098 |
10.71% |
| Ref |
 |
1,551 |
2.72% |
| Oth |
|
197 |
0.35% |
| Maj |
|
189 |
0.33% |
| Turn |
|
56,957 |
75.79% |
|
|
|
|
Conservative
|
| Con |
|
30,884 |
52.70% |
| Lab |
|
18,697 |
31.90% |
| LD |
|
9,012 |
15.40% |
| Oth |
|
0 |
0.00% |
| Maj |
|
12,187 |
20.80% |
| Turn |
|
58,593 |
80.95% |
|
|
|
|
|