|
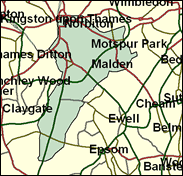
Kingston & Surbiton
Liberal Democrat hold

The Liberal Democrats' second closest win in 1997 (56 votes), Kingston and Surbiton is the most vulnerable of the five they are defending in outer SW London. This is not just because of their almost non-existent cushion, but also because Kingston is the weakest of the three London Boroughs involved for the Lib Dems, who have based their success in neighbouring Richmond upon Thames and Sutton on long-term and comfortable control of those boroughs. In May 1998 the Lib Dem candidates in Ed Davey's seat were just one pc ahead in the wards that make up this seat. A close and perhaps abrasive fight may be expected between this able young MP and his new challenger, the experienced former Conservative member for Dover, David Shaw.

Edward Davey, a Liberal Democrat Treasury spokesman, and co-originator of his Party's 'penny on income tax to pay for education' policy, won the seat in 1997 to his great and justifiable surprise given the subsequent loss of his party's control of Kingston Council a year later. A management consultant, he was born in 1965 and educated at Nottingham High School, Jesus College, Oxford and Birkbeck College, London. Clean-cut and personable, if to some patronising, he faces a hard fight against Conservative David Shaw, one of the more controversial partisan Thatcherite backbenchers during the 10 years (1987-97) he represented Dover. Disregarding Central Office advice, he has deserted Dover to seek a comeback in the town where he started his political career as a councillor. Born 1950, educated at King's College School, Wimbledon, and City of London Polytechnic, he was previously a chartered accountant with Coopers and Lybrand, has had directorships in local radio, brewing and pubs, and run a computer consultancy and property company. With a reputation among Labour MPs as a 'muck-raker', he sought to pin charges of nepotism in Monklands Council on Labour leader and local MP, John Smith, and since 1997 has fed Tory spokesmen with material on the financial links between Peter Mandelson and Geoffrey Robinson.
 |
| Wealthy Achievers, Suburban Areas |
22.24% |
14.99% |
148.36 |
|
| Affluent Greys, Rural Communities |
0.00% |
2.13% |
0.00 |
|
| Prosperous Pensioners, Retirement Areas |
1.73% |
2.49% |
69.56 |
|
| Affluent Executives, Family Areas |
0.44% |
4.43% |
9.96 |
|
| Well-Off Workers, Family Areas |
2.54% |
7.27% |
34.90 |
|
| Affluent Urbanites, Town & City Areas |
7.52% |
2.56% |
293.08 |
|
| Prosperous Professionals, Metropolitan Areas |
11.79% |
2.04% |
577.47 |
|
| Better-Off Executives, Inner City Areas |
7.65% |
3.94% |
193.88 |
|
| Comfortable Middle Agers, Mature Home Owning Areas |
16.67% |
13.04% |
127.83 |
|
| Skilled Workers, Home Owning Areas |
15.50% |
12.70% |
122.02 |
|
| New Home Owners, Mature Communities |
1.81% |
8.14% |
22.17 |
|
| White Collar Workers, Better-Off Multi Ethnic Areas |
4.93% |
4.02% |
122.70 |
|
| Older People, Less Prosperous Areas |
1.43% |
3.19% |
44.77 |
|
| Council Estate Residents, Better-Off Homes |
2.82% |
11.31% |
24.90 |
|
| Council Estate Residents, High Unemployment |
2.73% |
3.06% |
89.06 |
|
| Council Estate Residents, Greatest Hardship |
0.00% |
2.52% |
0.00 |
|
| People in Multi-Ethnic, Low-Income Areas |
0.15% |
2.10% |
7.26 |
|
| Unclassified |
0.07% |
0.06% |
108.12 |
|
|
 |
 |
 |
| £0-5K |
4.78% |
9.41% |
50.76 |
|
| £5-10K |
10.15% |
16.63% |
61.00 |
|
| £10-15K |
12.48% |
16.58% |
75.30 |
|
| £15-20K |
12.22% |
13.58% |
89.99 |
|
| £20-25K |
10.80% |
10.39% |
103.96 |
|
| £25-30K |
9.08% |
7.77% |
116.84 |
|
| £30-35K |
7.45% |
5.79% |
128.54 |
|
| £35-40K |
6.03% |
4.33% |
139.11 |
|
| £40-45K |
4.85% |
3.27% |
148.64 |
|
| £45-50K |
3.90% |
2.48% |
157.25 |
|
| £50-55K |
3.14% |
1.90% |
165.05 |
|
| £55-60K |
2.54% |
1.47% |
172.14 |
|
| £60-65K |
2.06% |
1.15% |
178.61 |
|
| £65-70K |
1.67% |
0.91% |
184.54 |
|
| £70-75K |
1.37% |
0.72% |
190.00 |
|
| £75-80K |
1.12% |
0.57% |
195.05 |
|
| £80-85K |
0.92% |
0.46% |
199.74 |
|
| £85-90K |
0.76% |
0.37% |
204.10 |
|
| £90-95K |
0.64% |
0.31% |
208.19 |
|
| £95-100K |
0.53% |
0.25% |
212.02 |
|
| £100K + |
3.12% |
1.34% |
232.23 |
|
|
|

|


|
1992-1997
|
1997-2001
|
|
|
|
| Con |
-16.43% |
| Lab |
3.41% |
| LD |
10.77% |
|
| Con |
-8.32% |
| Lab |
-14.25% |
| LD |
23.51% |
|
|
 |
Edward Davey
Liberal Democrat hold
|
| Con |
 |
13,866 |
28.24% |
| Lab |
 |
4,302 |
8.76% |
| LD |
 |
29,542 |
60.18% |
| Oth |
 |
1,383 |
2.82% |
| Maj |
 |
15,676 |
31.93% |
| Turn |
 |
49,093 |
67.54% |
|
|
 |
Edward Davey
Liberal Democrat hold
|
| UK |
Amy Burns |
438 |
0.89% |
| LD |
Edward Davey |
29,542 |
60.18% |
| SL |
John Hayball |
319 |
0.65% |
| U |
Jeremy Middleton |
54 |
0.11% |
| C |
David Shaw |
13,866 |
28.24% |
| G |
Chris Spruce |
572 |
1.17% |
| L |
Phil Woodford |
4,302 |
8.76% |
|
Candidates representing 7 parties stood for election to this seat.
|
|
 |
Edward Davey
Liberal Democrat gain
|
| Con |
 |
20,355 |
36.57% |
| Lab |
 |
12,811 |
23.01% |
| LD |
 |
20,411 |
36.67% |
| Ref |
 |
1,470 |
2.64% |
| Oth |
 |
618 |
1.11% |
| Maj |
 |
56 |
0.10% |
| Turn |
 |
55,665 |
75.35% |
|
|
 |
|
Conservative
|
| Con |
 |
29,674 |
53.00% |
| Lab |
 |
10,991 |
19.60% |
| LD |
 |
14,510 |
25.90% |
| Oth |
 |
762 |
1.40% |
| Maj |
 |
15,164 |
27.10% |
| Turn |
 |
55,937 |
79.64% |
|
|
 |
|

|

