|
Kingswood
Labour hold

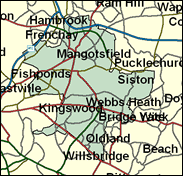
Kingswood in the eastern suburbs of the West Country metropolis of Bristol is one of those ordinary places which have in recent decades had an extraordinary importance as weathervane marginals in UK parliamentary politics. Its boundaries have fluctuated, and even small changes are significant in so competitive a seat, but essentially it fals to whichever party forms the national government. Thus through the 1980s boosting Mrs Thatcher's overall majority its member was the Conservative Rob Hayward, a rugby refereeing multiple sclerosis sufferer who after losing in 1992 became a leading lobbyist for the soft drinkls industry and a gay activist. For the last ten years Kingswood has been represented by Labour's Dr Berry, also a less than wholly typical example of his party leadership, but nevertheless one likely to form part of the not so small army of backbenchers literally behind Tony Blair's triumphant return for a second term in June 2001.

Dr Roger Berry, an academic economist originally elected in 1992, became virtuously identified with disability legislation, but has suffered from his equal keenness for left-Keynesian economics and a linked opposition to the deflationary economics of the Maastricht Treaty, seeing the European debate as the only place where the Labour left can raise the issues of tax, public spending and welfare. Born 1948 and educated at Huddersfield New College and Bristol University, he taught economics at Bristol University and spent 12 years on the local Avon County Council. Disliking Labour's 'Welfare to Work' programme, he has restricted his disobedience to welfare issues in voting against lone parent benefit cuts and in 1999 leading the revolt on disability allowance cuts with his own amendment.
 |
| Wealthy Achievers, Suburban Areas |
3.83% |
14.99% |
25.55 |
|
| Affluent Greys, Rural Communities |
0.00% |
2.13% |
0.00 |
|
| Prosperous Pensioners, Retirement Areas |
0.62% |
2.49% |
24.82 |
|
| Affluent Executives, Family Areas |
5.78% |
4.43% |
130.64 |
|
| Well-Off Workers, Family Areas |
9.79% |
7.27% |
134.64 |
|
| Affluent Urbanites, Town & City Areas |
0.15% |
2.56% |
5.93 |
|
| Prosperous Professionals, Metropolitan Areas |
0.15% |
2.04% |
7.14 |
|
| Better-Off Executives, Inner City Areas |
0.09% |
3.94% |
2.19 |
|
| Comfortable Middle Agers, Mature Home Owning Areas |
23.31% |
13.04% |
178.76 |
|
| Skilled Workers, Home Owning Areas |
28.85% |
12.70% |
227.13 |
|
| New Home Owners, Mature Communities |
14.49% |
8.14% |
177.99 |
|
| White Collar Workers, Better-Off Multi Ethnic Areas |
1.38% |
4.02% |
34.40 |
|
| Older People, Less Prosperous Areas |
5.86% |
3.19% |
184.02 |
|
| Council Estate Residents, Better-Off Homes |
5.23% |
11.31% |
46.24 |
|
| Council Estate Residents, High Unemployment |
0.46% |
3.06% |
15.12 |
|
| Council Estate Residents, Greatest Hardship |
0.00% |
2.52% |
0.00 |
|
| People in Multi-Ethnic, Low-Income Areas |
0.00% |
2.10% |
0.00 |
|
| Unclassified |
0.00% |
0.06% |
0.00 |
|
|
 |
 |
 |
| £0-5K |
8.43% |
9.41% |
89.50 |
|
| £5-10K |
16.71% |
16.63% |
100.44 |
|
| £10-15K |
17.82% |
16.58% |
107.51 |
|
| £15-20K |
14.96% |
13.58% |
110.16 |
|
| £20-25K |
11.38% |
10.39% |
109.50 |
|
| £25-30K |
8.30% |
7.77% |
106.74 |
|
| £30-35K |
5.95% |
5.79% |
102.80 |
|
| £35-40K |
4.26% |
4.33% |
98.28 |
|
| £40-45K |
3.06% |
3.27% |
93.58 |
|
| £45-50K |
2.21% |
2.48% |
88.93 |
|
| £50-55K |
1.61% |
1.90% |
84.45 |
|
| £55-60K |
1.18% |
1.47% |
80.21 |
|
| £60-65K |
0.88% |
1.15% |
76.25 |
|
| £65-70K |
0.66% |
0.91% |
72.57 |
|
| £70-75K |
0.50% |
0.72% |
69.17 |
|
| £75-80K |
0.38% |
0.57% |
66.03 |
|
| £80-85K |
0.29% |
0.46% |
63.13 |
|
| £85-90K |
0.23% |
0.37% |
60.46 |
|
| £90-95K |
0.18% |
0.31% |
58.00 |
|
| £95-100K |
0.14% |
0.25% |
55.73 |
|
| £100K + |
0.61% |
1.34% |
45.29 |
|
|
|

|


|
1992-1997
|
1997-2001
|
|
|
|
| Con |
-15.86% |
| Lab |
13.14% |
| LD |
-0.79% |
|
| Con |
-0.98% |
| Lab |
2.29% |
| LD |
2.21% |
|
|
 |
Roger Berry
Labour hold
|
| Con |
 |
14,941 |
28.96% |
| Lab |
 |
28,903 |
56.02% |
| LD |
 |
7,747 |
15.02% |
| Oth |
|
0 |
0.00% |
| Maj |
 |
13,962 |
27.06% |
| Turn |
 |
51,591 |
64.06% |
|
|
 |
Roger Berry
Labour hold
|
| L |
Roger Berry |
28,903 |
56.02% |
| LD |
Christopher Greenfield |
7,747 |
15.02% |
| C |
Robert Marven |
14,941 |
28.96% |
|
Candidates representing 3 parties stood for election to this seat.
|
|
 |
Roger Berry
Labour gain
|
| Con |
 |
17,928 |
29.94% |
| Lab |
 |
32,181 |
53.74% |
| LD |
 |
7,672 |
12.81% |
| Ref |
 |
1,463 |
2.44% |
| Oth |
 |
643 |
1.07% |
| Maj |
 |
14,253 |
23.80% |
| Turn |
 |
59,887 |
77.75% |
|
|
 |
|
Conservative
|
| Con |
 |
29,562 |
45.80% |
| Lab |
 |
26,222 |
40.60% |
| LD |
 |
8,771 |
13.60% |
| Oth |
|
0 |
0.00% |
| Maj |
 |
3,340 |
5.20% |
| Turn |
 |
64,555 |
84.58% |
|
|
 |
|

|

