|
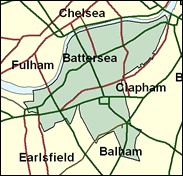
Battersea
Labour hold

Battersea continues to behave differently depending on whether the election is local or general. In the1997 general election Labour regained the seat; in the May 1998 local elections the Tories won 19 out of 22 seats in the constituency. It must be regarded as a possible gain on a six per cent swing. The aberrant history of Battersea in recent years has been much analysed. It is true that gentrification has been noticeable here in "South Chelsea", but elsewhere in London that has not usually helped the Conservatives. The incomers are often liberally minded young urban professionals. Much more important is the establishment of Conservative voting patterns on the base of an almost uniquely successful local government policy and regime. Wandsworth Borough has remained very firmly in Conservative hands since the early 1980s, offering low rates, then low poll tax, and now low council tax. The electors love it, and this has usually been translated into better than average results in general elections too, although this was not obvious in Labour's national landslide in 1997. Nevertheless, a recovery both in Battersea and in Putney is very much on the cards should the Labour government stumble even slightly.

Martin Linton, Labour's 1997 victor, a half-Swedish Guardian journalist, dubbed by a former colleague on that paper as ‘a promising lick-spittle', was born in 1944 and educated at Christ's Hospital and Pembroke College, Oxford. Known mainly as an advocate of PR and transparent party funding, and for a rather earnest mien, he is also an accomplished tickler-of- the-ivories at Battersea Labour Party soirees at the annual Party Conference, and thinks he's done more as an MP than as a Guardian journalist. Seeking a Tory return in this part of the Conservatives' flagship borough of Wandsworth is Lucy Shersby, daughter of the late Tory MP Sir Michael Shersby. Personable and toothy, born 1965, and educated at James Allan Girls' School, Dulwich and Durham University, she too is a journalist - on The Sun. Statistically, The Guardian should see off The Sun in Battersea.
 |
| Wealthy Achievers, Suburban Areas |
0.00% |
14.99% |
0.00 |
|
| Affluent Greys, Rural Communities |
0.00% |
2.13% |
0.00 |
|
| Prosperous Pensioners, Retirement Areas |
0.00% |
2.49% |
0.00 |
|
| Affluent Executives, Family Areas |
0.00% |
4.43% |
0.00 |
|
| Well-Off Workers, Family Areas |
0.00% |
7.27% |
0.00 |
|
| Affluent Urbanites, Town & City Areas |
4.05% |
2.56% |
157.85 |
|
| Prosperous Professionals, Metropolitan Areas |
48.45% |
2.04% |
2,373.79 |
|
| Better-Off Executives, Inner City Areas |
14.37% |
3.94% |
364.35 |
|
| Comfortable Middle Agers, Mature Home Owning Areas |
0.00% |
13.04% |
0.00 |
|
| Skilled Workers, Home Owning Areas |
0.55% |
12.70% |
4.37 |
|
| New Home Owners, Mature Communities |
0.00% |
8.14% |
0.00 |
|
| White Collar Workers, Better-Off Multi Ethnic Areas |
5.10% |
4.02% |
126.79 |
|
| Older People, Less Prosperous Areas |
0.00% |
3.19% |
0.00 |
|
| Council Estate Residents, Better-Off Homes |
0.00% |
11.31% |
0.00 |
|
| Council Estate Residents, High Unemployment |
9.33% |
3.06% |
304.81 |
|
| Council Estate Residents, Greatest Hardship |
0.00% |
2.52% |
0.00 |
|
| People in Multi-Ethnic, Low-Income Areas |
18.13% |
2.10% |
863.17 |
|
| Unclassified |
0.02% |
0.06% |
28.91 |
|
|
 |
 |
 |
| £0-5K |
5.79% |
9.41% |
61.54 |
|
| £5-10K |
10.42% |
16.63% |
62.63 |
|
| £10-15K |
11.84% |
16.58% |
71.41 |
|
| £15-20K |
11.24% |
13.58% |
82.78 |
|
| £20-25K |
9.90% |
10.39% |
95.27 |
|
| £25-30K |
8.41% |
7.77% |
108.21 |
|
| £30-35K |
7.02% |
5.79% |
121.24 |
|
| £35-40K |
5.81% |
4.33% |
134.14 |
|
| £40-45K |
4.79% |
3.27% |
146.78 |
|
| £45-50K |
3.95% |
2.48% |
159.10 |
|
| £50-55K |
3.26% |
1.90% |
171.06 |
|
| £55-60K |
2.69% |
1.47% |
182.65 |
|
| £60-65K |
2.23% |
1.15% |
193.88 |
|
| £65-70K |
1.86% |
0.91% |
204.76 |
|
| £70-75K |
1.55% |
0.72% |
215.29 |
|
| £75-80K |
1.30% |
0.57% |
225.50 |
|
| £80-85K |
1.09% |
0.46% |
235.40 |
|
| £85-90K |
0.92% |
0.37% |
245.01 |
|
| £90-95K |
0.78% |
0.31% |
254.35 |
|
| £95-100K |
0.66% |
0.25% |
263.44 |
|
| £100K + |
4.31% |
1.34% |
320.38 |
|
|
|

|


|
1992-1997
|
1997-2001
|
|
|
|
| Con |
-10.97% |
| Lab |
9.44% |
| LD |
0.25% |
|
| Con |
-2.90% |
| Lab |
-0.47% |
| LD |
4.74% |
|
|
 |
Martin Linton
Labour hold
|
| Con |
 |
13,445 |
36.53% |
| Lab |
 |
18,498 |
50.26% |
| LD |
 |
4,450 |
12.09% |
| Oth |
 |
411 |
1.12% |
| Maj |
 |
5,053 |
13.73% |
| Turn |
 |
36,804 |
54.53% |
|
|
 |
Martin Linton
Labour hold
|
| I |
Thomas Barber |
411 |
1.12% |
| L |
Martin Linton |
18,498 |
50.26% |
| C |
Lucy Shersby |
13,445 |
36.53% |
| LD |
Siobhan Vitelli |
4,450 |
12.09% |
|
Candidates representing 4 parties stood for election to this seat.
|
|
 |
Martin Linton
Labour gain
|
| Con |
 |
18,687 |
39.43% |
| Lab |
 |
24,047 |
50.74% |
| LD |
 |
3,482 |
7.35% |
| Ref |
 |
804 |
1.70% |
| Oth |
 |
377 |
0.80% |
| Maj |
 |
5,360 |
11.31% |
| Turn |
 |
47,397 |
70.82% |
|
|
 |
|
Conservative
|
| Con |
 |
26,411 |
50.40% |
| Lab |
 |
21,630 |
41.30% |
| LD |
 |
3,700 |
7.10% |
| Oth |
 |
686 |
1.30% |
| Maj |
 |
4,781 |
9.10% |
| Turn |
 |
52,427 |
77.75% |
|
|
 |
|

|

