|
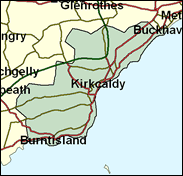
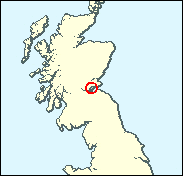
Kirkcaldy
Labour hold

The "Lang Toun" of Kirkcaldy has a mile long esplanade on the Firth of Forth, but the birthplace of Adam Smith and Robert Adam is not really a seaside resort. It is an industrial, working class town of solid Labour support. Even in 1955, the high water mark of modern Conservatism in Scotland when they won more than half the seats, they could get no closer than 7,500 votes behind Labour. Once a port for the Fife coalfield and a centre of the linoleum industry, Kirkcaldy has diversified its range of employment services, althoughgh its rate of joblessness is still a little higher than the Scottish average, and considerably higher than the British average. The SNP are clearly second here, but are unlikely to pose a painful challenge to Labour's Lewis Moonie.

Dr Lewis Moonie, unlike the numberless ranks of Labour doctorates, actually has a real one - in medicine - albeit psychiatric medicine. Elected here in 1987 and a frontbench spokesman for eight years, he was dropped by Blair on the morrow of victory, but then oddly recalled as a Defence Minister in 2000. Born 1947, son of a Tory accountant, he attended Grove Academy, Dundee, and St. Andrew's and Edinburgh Universities. Barrel-shaped in the manner of Scots Labour MPs, he is nonetheless, as a linguist and chess player, a good deal more cerebral than most and would no doubt have had an interesting professional line on why his predecessor as MP, Harry Gourlay, had recourse to a toupee.
 |
| Wealthy Achievers, Suburban Areas |
6.80% |
14.99% |
45.33 |
|
| Affluent Greys, Rural Communities |
0.02% |
2.13% |
0.92 |
|
| Prosperous Pensioners, Retirement Areas |
1.17% |
2.49% |
46.90 |
|
| Affluent Executives, Family Areas |
2.49% |
4.43% |
56.17 |
|
| Well-Off Workers, Family Areas |
7.97% |
7.27% |
109.53 |
|
| Affluent Urbanites, Town & City Areas |
4.98% |
2.56% |
194.20 |
|
| Prosperous Professionals, Metropolitan Areas |
0.01% |
2.04% |
0.30 |
|
| Better-Off Executives, Inner City Areas |
1.24% |
3.94% |
31.36 |
|
| Comfortable Middle Agers, Mature Home Owning Areas |
4.72% |
13.04% |
36.18 |
|
| Skilled Workers, Home Owning Areas |
5.47% |
12.70% |
43.03 |
|
| New Home Owners, Mature Communities |
7.72% |
8.14% |
94.78 |
|
| White Collar Workers, Better-Off Multi Ethnic Areas |
1.52% |
4.02% |
37.92 |
|
| Older People, Less Prosperous Areas |
11.73% |
3.19% |
368.33 |
|
| Council Estate Residents, Better-Off Homes |
22.92% |
11.31% |
202.61 |
|
| Council Estate Residents, High Unemployment |
16.01% |
3.06% |
522.75 |
|
| Council Estate Residents, Greatest Hardship |
5.26% |
2.52% |
208.77 |
|
| People in Multi-Ethnic, Low-Income Areas |
0.00% |
2.10% |
0.00 |
|
| Unclassified |
0.00% |
0.06% |
0.00 |
|
|
 |
|
|
| £0-5K |
12.86% |
9.41% |
136.63 |
|
| £5-10K |
20.65% |
16.63% |
124.16 |
|
| £10-15K |
18.37% |
16.58% |
110.78 |
|
| £15-20K |
13.61% |
13.58% |
100.17 |
|
| £20-25K |
9.58% |
10.39% |
92.15 |
|
| £25-30K |
6.69% |
7.77% |
86.06 |
|
| £30-35K |
4.71% |
5.79% |
81.34 |
|
| £35-40K |
3.36% |
4.33% |
77.59 |
|
| £40-45K |
2.43% |
3.27% |
74.50 |
|
| £45-50K |
1.78% |
2.48% |
71.89 |
|
| £50-55K |
1.33% |
1.90% |
69.62 |
|
| £55-60K |
1.00% |
1.47% |
67.60 |
|
| £60-65K |
0.76% |
1.15% |
65.78 |
|
| £65-70K |
0.58% |
0.91% |
64.10 |
|
| £70-75K |
0.45% |
0.72% |
62.53 |
|
| £75-80K |
0.35% |
0.57% |
61.06 |
|
| £80-85K |
0.28% |
0.46% |
59.67 |
|
| £85-90K |
0.22% |
0.37% |
58.34 |
|
| £90-95K |
0.17% |
0.31% |
57.07 |
|
| £95-100K |
0.14% |
0.25% |
55.85 |
|
| £100K + |
0.66% |
1.34% |
48.79 |
|
|
|
|


|
1992-1997
|
1997-2001
|
|
|
|
| Con |
-8.44% |
| Lab |
7.96% |
| LD |
-1.03% |
| SNP |
0.33% |
|
| Con |
-2.96% |
| Lab |
0.52% |
| LD |
1.45% |
| SNP |
-0.69% |
|
|
|
Lewis Moonie
Labour hold
|
| Con |
 |
3,013 |
10.70% |
| Lab |
 |
15,227 |
54.08% |
| LD |
 |
2,849 |
10.12% |
| SNP |
 |
6,264 |
22.25% |
| Oth |
 |
804 |
2.86% |
| Maj |
 |
8,963 |
31.83% |
| Turn |
|
28,157 |
54.61% |
|
|
|
Lewis Moonie
Labour hold
|
| C |
Scott Campbell |
3,013 |
10.70% |
| SSP |
Dougie Kinnear |
804 |
2.86% |
| LC |
Lewis Moonie |
15,227 |
54.08% |
| SNP |
Shirley-Ann Somerville |
6,264 |
22.25% |
| LD |
Andrew Weston |
2,849 |
10.12% |
|
Candidates representing 5 parties stood for election to this seat.
|
|
|
Lewis Moonie
Labour
|
| Con |
|
4,779 |
13.66% |
| Lab |
|
18,730 |
53.56% |
| LD |
|
3,031 |
8.67% |
| SNP |
|
8,020 |
22.93% |
| Ref |
 |
413 |
1.18% |
| Oth |
|
0 |
0.00% |
| Maj |
|
10,710 |
30.62% |
| Turn |
|
34,973 |
67.02% |
|
|
|
|
Labour
|
| Con |
|
8,361 |
22.10% |
| Lab |
|
17,246 |
45.60% |
| LD |
|
3,671 |
9.70% |
| SNP |
|
8,561 |
22.60% |
| Oth |
|
0 |
0.00% |
| Maj |
|
8,685 |
23.00% |
| Turn |
|
37,839 |
74.43% |
|
|
|
|
|