|
Knowsley North & Sefton East
Labour hold

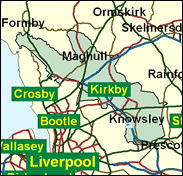
A curiously named, and indeed curiously drawn seat. This division bears that name more appositely than most, for it is divided, not only between Knowsley borough and Sefton, but between overwhelmingly working class Kirkby, which forms most of the Knowsley section, and middle class owner occupied Maghull, formerly placed with Crosby and Formby in the Sefton seat of Crosby. Maghull was happier with those partners, in a seat which was Tory (with a year of SDP representation after Shirley Williams won the 1982 by-election) until Labour's astonishing victory in 1997. But that is eminently reversible, whereas this seat has a 26,000 Labour majority and will not be Tory until the crack of doom. More boundary changes seem to be Maghull's only hope. Is Kirkby so terrifying? Many would say yes. This was the setting of the BBC's pioneering "realistic" TV police series Z Cars in the early 1960s, though it is not an official "New Town", but rather a series of council housing estates which took slum clearance overspill from Liverpool in the 1950s, when its population rose from 3,000 to 52,000. Parts have been demolished now, like the notorious Tower Hill, but it still has a battery of indicators of urban deprivation. The estate originally known as Cantril Farm, also from the Knowsley majority of this seat, may have an even worse reputation; for its name was changed to Stockbridge Village because of its association with crime and drugs.

George Howarth was elected here in 1986 as a less photogenic replacement for the departed-for-TV, perma-tanned, Prime-Minister-who-never-was, Robert Kilroy-Silk. Inserted here as part of the campaign to erode Militant influence on Merseyside, he reached the front bench in 1990 and has been a competent if colourless bottom ranking minister since 1997, currently in Northern Ireland. A fitter-turned-TUC-official, he was born locally in 1949 and attended Huyton Secondary School, Kirkby FE College, Liverpool Polytechnic and Salford University. Likened in appearance in the Guardian to a "serial killer", he retorted that "appearances are not always deceptive".
 |
| Wealthy Achievers, Suburban Areas |
3.98% |
14.99% |
26.53 |
|
| Affluent Greys, Rural Communities |
0.00% |
2.13% |
0.00 |
|
| Prosperous Pensioners, Retirement Areas |
0.27% |
2.49% |
11.02 |
|
| Affluent Executives, Family Areas |
1.97% |
4.43% |
44.44 |
|
| Well-Off Workers, Family Areas |
20.69% |
7.27% |
284.42 |
|
| Affluent Urbanites, Town & City Areas |
0.00% |
2.56% |
0.00 |
|
| Prosperous Professionals, Metropolitan Areas |
0.00% |
2.04% |
0.00 |
|
| Better-Off Executives, Inner City Areas |
0.29% |
3.94% |
7.37 |
|
| Comfortable Middle Agers, Mature Home Owning Areas |
24.21% |
13.04% |
185.71 |
|
| Skilled Workers, Home Owning Areas |
5.73% |
12.70% |
45.12 |
|
| New Home Owners, Mature Communities |
2.68% |
8.14% |
32.92 |
|
| White Collar Workers, Better-Off Multi Ethnic Areas |
0.39% |
4.02% |
9.69 |
|
| Older People, Less Prosperous Areas |
1.57% |
3.19% |
49.44 |
|
| Council Estate Residents, Better-Off Homes |
30.97% |
11.31% |
273.79 |
|
| Council Estate Residents, High Unemployment |
2.46% |
3.06% |
80.36 |
|
| Council Estate Residents, Greatest Hardship |
4.40% |
2.52% |
174.78 |
|
| People in Multi-Ethnic, Low-Income Areas |
0.00% |
2.10% |
0.00 |
|
| Unclassified |
0.38% |
0.06% |
613.34 |
|
|
 |
|
|
| £0-5K |
13.11% |
9.41% |
139.23 |
|
| £5-10K |
20.15% |
16.63% |
121.17 |
|
| £10-15K |
18.02% |
16.58% |
108.70 |
|
| £15-20K |
13.62% |
13.58% |
100.28 |
|
| £20-25K |
9.76% |
10.39% |
93.91 |
|
| £25-30K |
6.89% |
7.77% |
88.57 |
|
| £30-35K |
4.85% |
5.79% |
83.81 |
|
| £35-40K |
3.44% |
4.33% |
79.45 |
|
| £40-45K |
2.46% |
3.27% |
75.42 |
|
| £45-50K |
1.78% |
2.48% |
71.67 |
|
| £50-55K |
1.30% |
1.90% |
68.19 |
|
| £55-60K |
0.96% |
1.47% |
64.96 |
|
| £60-65K |
0.71% |
1.15% |
61.98 |
|
| £65-70K |
0.54% |
0.91% |
59.22 |
|
| £70-75K |
0.41% |
0.72% |
56.67 |
|
| £75-80K |
0.31% |
0.57% |
54.32 |
|
| £80-85K |
0.24% |
0.46% |
52.15 |
|
| £85-90K |
0.19% |
0.37% |
50.13 |
|
| £90-95K |
0.15% |
0.31% |
48.27 |
|
| £95-100K |
0.12% |
0.25% |
46.55 |
|
| £100K + |
0.52% |
1.34% |
38.40 |
|
|
|
|


|
1992-1997
|
1997-2001
|
|
|
|
| Con |
-9.50% |
| Lab |
15.51% |
| LD |
-4.54% |
|
| Con |
-1.02% |
| Lab |
-3.18% |
| LD |
2.72% |
|
|
|
George Howarth
Labour hold
|
| Con |
 |
6,108 |
16.28% |
| Lab |
 |
25,035 |
66.73% |
| LD |
 |
5,173 |
13.79% |
| Oth |
 |
1,201 |
3.20% |
| Maj |
 |
18,927 |
50.45% |
| Turn |
|
37,517 |
53.00% |
|
|
|
George Howarth
Labour hold
|
| C |
Keith Chapman |
6,108 |
16.28% |
| L |
George Howarth |
25,035 |
66.73% |
| IJ |
David Jones |
271 |
0.72% |
| LD |
Richard Roberts |
5,173 |
13.79% |
| IR |
Thomas Rossiter |
356 |
0.95% |
| SL |
Ron Waugh |
574 |
1.53% |
|
Candidates representing 6 parties stood for election to this seat.
|
|
|
George Howarth
Labour
|
| Con |
|
8,600 |
17.30% |
| Lab |
|
34,747 |
69.91% |
| LD |
|
5,499 |
11.06% |
| Ref |
|
0 |
0.00% |
| Oth |
|
857 |
1.72% |
| Maj |
|
26,147 |
52.61% |
| Turn |
|
49,703 |
70.09% |
|
|
|
|
Labour
|
| Con |
|
14,930 |
26.80% |
| Lab |
|
30,316 |
54.40% |
| LD |
|
8,670 |
15.60% |
| Oth |
|
1,805 |
3.20% |
| Maj |
|
15,386 |
27.60% |
| Turn |
|
55,721 |
75.14% |
|
|
|
|
|