|
Knowsley South
Labour hold

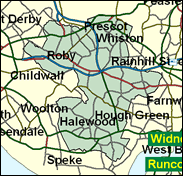
The largest numerical majority for any party in 1997, 30,708, was recorded in Knowsley South, in Labour's interest. This is not actually the safest seat of all in percentage terms, that is, by the swing of votes needed to oust the sitting MP. At 64.5pc majority, requiring a swing of 33pc, there are ten safer seats, all Labour (Labour actually had the 118 safest seats in 1997, not including the Speaker, and 113 if one does). The reason why it was not at the top of the safety list too was that the ten above it had fewer votes cast, because they were smaller in electorate (half were in Wales where the number of voters per seat is set to be fewer) or because the turnout was much lower, as in Liverpool Walton. Knowsley South will for ever be associated with Harold Wilson, who won four General Elections as leader of the Labour party. When he was first elected the seat was called Huyton, and his excellent relationship with it as well as social and housing change and long term swing in Merseyside saw him build up his majority, for example from 6,000 in 1959 to 19,000 in 1964 - he also became party leader during this period, which may have helped his profile too. Huyton and Roby, joined in this seat by Whiston, Halewood (site of a huge Ford car plant) and now Prescot, where they make cables, used to be regarded as a cut above Liverpool itself, but many Scousers moved in to the large council estates of Woolfall Heath, Page Moss and Longview, bring a distinctive accent, tone and attitude. This is not the inner city: it would not have so large and stable a population and average turnout rates if it were; but a visit will soon explain better than in words why it has the largest Labour lead of all.

Eddie O'Hara, an unobtrusive MP here since 1990, comes, Bootle-born, with good working class credentials, if over-laid with education at Liverpool Collegiate School and Magdalen College, Oxford, and a teaching career taking him to Liverpool Polytechnic via several years as a classics master in two public schools. His passion for the Classics explains his partiality for Greek Cyprus and for most things Greek. As a Merseyside MP he defends local pools interests against the National Lottery, and has translated Beatles songs into Latin.
 |
| Wealthy Achievers, Suburban Areas |
3.33% |
14.99% |
22.23 |
|
| Affluent Greys, Rural Communities |
0.00% |
2.13% |
0.00 |
|
| Prosperous Pensioners, Retirement Areas |
0.29% |
2.49% |
11.73 |
|
| Affluent Executives, Family Areas |
5.06% |
4.43% |
114.43 |
|
| Well-Off Workers, Family Areas |
10.32% |
7.27% |
141.82 |
|
| Affluent Urbanites, Town & City Areas |
0.35% |
2.56% |
13.72 |
|
| Prosperous Professionals, Metropolitan Areas |
0.00% |
2.04% |
0.00 |
|
| Better-Off Executives, Inner City Areas |
0.14% |
3.94% |
3.63 |
|
| Comfortable Middle Agers, Mature Home Owning Areas |
16.25% |
13.04% |
124.64 |
|
| Skilled Workers, Home Owning Areas |
8.52% |
12.70% |
67.11 |
|
| New Home Owners, Mature Communities |
7.26% |
8.14% |
89.14 |
|
| White Collar Workers, Better-Off Multi Ethnic Areas |
0.23% |
4.02% |
5.61 |
|
| Older People, Less Prosperous Areas |
3.28% |
3.19% |
103.05 |
|
| Council Estate Residents, Better-Off Homes |
37.33% |
11.31% |
330.01 |
|
| Council Estate Residents, High Unemployment |
1.55% |
3.06% |
50.67 |
|
| Council Estate Residents, Greatest Hardship |
6.04% |
2.52% |
239.70 |
|
| People in Multi-Ethnic, Low-Income Areas |
0.00% |
2.10% |
0.00 |
|
| Unclassified |
0.04% |
0.06% |
67.53 |
|
|
 |
 |
 |
| £0-5K |
13.85% |
9.41% |
147.17 |
|
| £5-10K |
20.79% |
16.63% |
124.98 |
|
| £10-15K |
18.29% |
16.58% |
110.33 |
|
| £15-20K |
13.58% |
13.58% |
99.95 |
|
| £20-25K |
9.56% |
10.39% |
92.02 |
|
| £25-30K |
6.66% |
7.77% |
85.61 |
|
| £30-35K |
4.64% |
5.79% |
80.19 |
|
| £35-40K |
3.27% |
4.33% |
75.48 |
|
| £40-45K |
2.33% |
3.27% |
71.32 |
|
| £45-50K |
1.68% |
2.48% |
67.58 |
|
| £50-55K |
1.22% |
1.90% |
64.21 |
|
| £55-60K |
0.90% |
1.47% |
61.15 |
|
| £60-65K |
0.67% |
1.15% |
58.36 |
|
| £65-70K |
0.51% |
0.91% |
55.81 |
|
| £70-75K |
0.38% |
0.72% |
53.48 |
|
| £75-80K |
0.30% |
0.57% |
51.34 |
|
| £80-85K |
0.23% |
0.46% |
49.38 |
|
| £85-90K |
0.18% |
0.37% |
47.57 |
|
| £90-95K |
0.14% |
0.31% |
45.91 |
|
| £95-100K |
0.11% |
0.25% |
44.38 |
|
| £100K + |
0.51% |
1.34% |
37.62 |
|
|
|

|


|
1992-1997
|
1997-2001
|
|
|
|
| Con |
-7.92% |
| Lab |
7.61% |
| LD |
-0.69% |
|
| Con |
-0.97% |
| Lab |
-5.85% |
| LD |
4.69% |
|
|
 |
Eddie O'Hara
Labour hold
|
| Con |
 |
4,250 |
11.62% |
| Lab |
 |
26,071 |
71.25% |
| LD |
 |
4,755 |
13.00% |
| Oth |
 |
1,514 |
4.14% |
| Maj |
 |
21,316 |
58.26% |
| Turn |
 |
36,590 |
51.77% |
|
|
 |
Eddie O'Hara
Labour hold
|
| SL |
Alan Fogg |
1,068 |
2.92% |
| C |
Paul Jemetta |
4,250 |
11.62% |
| I |
Mona McNee |
446 |
1.22% |
| L |
Eddie O'Hara |
26,071 |
71.25% |
| LD |
David Smithson |
4,755 |
13.00% |
|
Candidates representing 5 parties stood for election to this seat.
|
|
 |
Eddie O'Hara
Labour
|
| Con |
 |
5,987 |
12.58% |
| Lab |
 |
36,695 |
77.11% |
| LD |
 |
3,954 |
8.31% |
| Ref |
 |
954 |
2.00% |
| Oth |
|
0 |
0.00% |
| Maj |
 |
30,708 |
64.53% |
| Turn |
 |
47,590 |
67.47% |
|
|
 |
|
Labour
|
| Con |
 |
10,936 |
20.50% |
| Lab |
 |
37,071 |
69.50% |
| LD |
 |
4,818 |
9.00% |
| Oth |
 |
487 |
0.90% |
| Maj |
 |
26,135 |
49.00% |
| Turn |
 |
53,312 |
73.76% |
|
|
 |
|

|

