|
Lancashire West
Labour hold

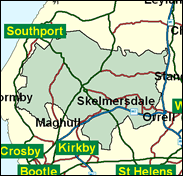
Once upon a time the West Lancashire seat could be introduced as a starkly divided marginal, with very little in common between its two constituent parts, Skelmersdale New Town and the very Conservative communities of the plain around Ormskirk. Now however the Labour element has overwhelmed all opposition, as Colin Pickthall, who gained the seat from Kenneth Hind in 1992, won by over 17,000 in 1997. This was partly due to the removal of some Tory villages to the north to join South Ribble, which is still marginal. It is far more due to the national and regional swing to Labour, and even if Skelmersdale should demonstrate a low turnout in the next General Election this will not loosen Labour's grip.

Colin Pickthall, Jack Straw's PPS and a man with a rough-hewn piratical visage and beard, won this seat for Labour in 1992. A unilateralist leftwinger-turned-loyalist, he was born in 1944, attended Ulverston Grammar School and the Universities of Wales and Lancaster, and then taught in schools and higher education colleges for 25 years. An insulin-dependent diabetic, he opposes hare coursing - practised in his constituency at the Waterloo Cup - and backs the standard Labour teachers' opposition to league tables and selective schooling.
 |
| Wealthy Achievers, Suburban Areas |
26.40% |
14.99% |
176.10 |
|
| Affluent Greys, Rural Communities |
0.45% |
2.13% |
21.18 |
|
| Prosperous Pensioners, Retirement Areas |
0.99% |
2.49% |
40.01 |
|
| Affluent Executives, Family Areas |
2.95% |
4.43% |
66.60 |
|
| Well-Off Workers, Family Areas |
10.76% |
7.27% |
147.91 |
|
| Affluent Urbanites, Town & City Areas |
0.65% |
2.56% |
25.28 |
|
| Prosperous Professionals, Metropolitan Areas |
0.10% |
2.04% |
4.72 |
|
| Better-Off Executives, Inner City Areas |
0.00% |
3.94% |
0.00 |
|
| Comfortable Middle Agers, Mature Home Owning Areas |
15.97% |
13.04% |
122.45 |
|
| Skilled Workers, Home Owning Areas |
9.49% |
12.70% |
74.74 |
|
| New Home Owners, Mature Communities |
3.81% |
8.14% |
46.75 |
|
| White Collar Workers, Better-Off Multi Ethnic Areas |
0.00% |
4.02% |
0.00 |
|
| Older People, Less Prosperous Areas |
2.05% |
3.19% |
64.45 |
|
| Council Estate Residents, Better-Off Homes |
15.38% |
11.31% |
135.99 |
|
| Council Estate Residents, High Unemployment |
0.91% |
3.06% |
29.72 |
|
| Council Estate Residents, Greatest Hardship |
10.09% |
2.52% |
400.59 |
|
| People in Multi-Ethnic, Low-Income Areas |
0.00% |
2.10% |
0.00 |
|
| Unclassified |
0.00% |
0.06% |
0.00 |
|
|
 |
 |
 |
| £0-5K |
9.15% |
9.41% |
97.21 |
|
| £5-10K |
16.06% |
16.63% |
96.54 |
|
| £10-15K |
16.31% |
16.58% |
98.40 |
|
| £15-20K |
13.64% |
13.58% |
100.42 |
|
| £20-25K |
10.60% |
10.39% |
101.99 |
|
| £25-30K |
8.01% |
7.77% |
103.03 |
|
| £30-35K |
6.00% |
5.79% |
103.62 |
|
| £35-40K |
4.50% |
4.33% |
103.85 |
|
| £40-45K |
3.39% |
3.27% |
103.82 |
|
| £45-50K |
2.57% |
2.48% |
103.60 |
|
| £50-55K |
1.97% |
1.90% |
103.25 |
|
| £55-60K |
1.52% |
1.47% |
102.80 |
|
| £60-65K |
1.18% |
1.15% |
102.28 |
|
| £65-70K |
0.92% |
0.91% |
101.71 |
|
| £70-75K |
0.73% |
0.72% |
101.11 |
|
| £75-80K |
0.58% |
0.57% |
100.48 |
|
| £80-85K |
0.46% |
0.46% |
99.84 |
|
| £85-90K |
0.37% |
0.37% |
99.19 |
|
| £90-95K |
0.30% |
0.31% |
98.53 |
|
| £95-100K |
0.24% |
0.25% |
97.87 |
|
| £100K + |
1.25% |
1.34% |
93.20 |
|
|
|

|


|
1992-1997
|
1997-2001
|
|
|
|
| Con |
-13.24% |
| Lab |
10.94% |
| LD |
0.20% |
|
| Con |
2.97% |
| Lab |
-5.87% |
| LD |
4.36% |
|
|
 |
Colin Pickthall
Labour hold
|
| Con |
 |
13,761 |
32.02% |
| Lab |
 |
23,404 |
54.46% |
| LD |
 |
4,966 |
11.56% |
| Oth |
 |
840 |
1.95% |
| Maj |
 |
9,643 |
22.44% |
| Turn |
 |
42,971 |
58.98% |
|
|
 |
Colin Pickthall
Labour hold
|
| Ind Braid |
David Braid |
317 |
0.74% |
| Ind Hill |
David Hill |
523 |
1.22% |
| C |
Jeremy Myers |
13,761 |
32.02% |
| L |
Colin Pickthall |
23,404 |
54.46% |
| LD |
John Thornton |
4,966 |
11.56% |
|
Candidates representing 5 parties stood for election to this seat.
|
|
 |
Colin Pickthall
Labour
|
| Con |
 |
15,903 |
29.06% |
| Lab |
 |
33,022 |
60.34% |
| LD |
 |
3,938 |
7.20% |
| Ref |
 |
1,025 |
1.87% |
| Oth |
 |
841 |
1.54% |
| Maj |
 |
17,119 |
31.28% |
| Turn |
 |
54,729 |
74.79% |
|
|
 |
|
Labour
|
| Con |
 |
25,243 |
42.30% |
| Lab |
 |
29,470 |
49.40% |
| LD |
 |
4,147 |
7.00% |
| Oth |
 |
792 |
1.30% |
| Maj |
 |
4,227 |
7.10% |
| Turn |
 |
59,652 |
81.70% |
|
|
 |
|

|

