|
Leeds East
Labour hold

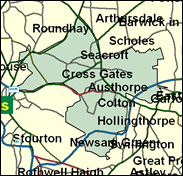
This is a seat with a long and distinguished Labour tradition, most notably as the descendant of the area which elected two men widely regarded as unlucky never to be Prime Minister, Hugh Gaitskell and Denis Healey. Apart form the middle class Halton ward, this side of Leeds remains solidly loyal to their intellectual heirs now in government: the tone of the neighbourhoods varies from peripheral council at Seacroft, to inner city redevelopment at Burmantofts, and largely non-white populated older terraces at Harehills.

George Mudie was elected in 1992, having been leader of Leeds City Council for ten years. One of a score of Scots representing English seats for Labour, he was born in 1945, educated at Lawside Academy, Dundee (and later at Newbattle Abbey College, Midlothian), and worked as an engineer until becoming a NUPE official for 24 years. Very locally focused, and Old Labour, he rose quickly in the Whips Office from 1994, to Deputy Chief Whip by 1997, but was switched to Education as a junior minister after refusing a posting to Northern Ireland, and dropped altogether a year later. He is one of Labour's small minority who vote against homosexual sex at 16, and as a former big city boss, dislikes regional government.
 |
| Wealthy Achievers, Suburban Areas |
2.70% |
14.99% |
17.99 |
|
| Affluent Greys, Rural Communities |
0.09% |
2.13% |
4.28 |
|
| Prosperous Pensioners, Retirement Areas |
0.66% |
2.49% |
26.35 |
|
| Affluent Executives, Family Areas |
4.53% |
4.43% |
102.35 |
|
| Well-Off Workers, Family Areas |
3.53% |
7.27% |
48.54 |
|
| Affluent Urbanites, Town & City Areas |
0.18% |
2.56% |
6.94 |
|
| Prosperous Professionals, Metropolitan Areas |
0.00% |
2.04% |
0.00 |
|
| Better-Off Executives, Inner City Areas |
1.47% |
3.94% |
37.29 |
|
| Comfortable Middle Agers, Mature Home Owning Areas |
14.61% |
13.04% |
112.02 |
|
| Skilled Workers, Home Owning Areas |
9.23% |
12.70% |
72.69 |
|
| New Home Owners, Mature Communities |
9.31% |
8.14% |
114.36 |
|
| White Collar Workers, Better-Off Multi Ethnic Areas |
0.97% |
4.02% |
24.12 |
|
| Older People, Less Prosperous Areas |
4.44% |
3.19% |
139.49 |
|
| Council Estate Residents, Better-Off Homes |
26.47% |
11.31% |
234.04 |
|
| Council Estate Residents, High Unemployment |
6.67% |
3.06% |
217.66 |
|
| Council Estate Residents, Greatest Hardship |
10.25% |
2.52% |
406.90 |
|
| People in Multi-Ethnic, Low-Income Areas |
4.90% |
2.10% |
233.17 |
|
| Unclassified |
0.00% |
0.06% |
0.00 |
|
|
 |
 |
 |
| £0-5K |
13.39% |
9.41% |
142.23 |
|
| £5-10K |
22.53% |
16.63% |
135.44 |
|
| £10-15K |
19.75% |
16.58% |
119.14 |
|
| £15-20K |
14.09% |
13.58% |
103.74 |
|
| £20-25K |
9.46% |
10.39% |
91.06 |
|
| £25-30K |
6.29% |
7.77% |
80.91 |
|
| £30-35K |
4.22% |
5.79% |
72.77 |
|
| £35-40K |
2.87% |
4.33% |
66.15 |
|
| £40-45K |
1.98% |
3.27% |
60.66 |
|
| £45-50K |
1.39% |
2.48% |
56.04 |
|
| £50-55K |
0.99% |
1.90% |
52.09 |
|
| £55-60K |
0.72% |
1.47% |
48.66 |
|
| £60-65K |
0.53% |
1.15% |
45.64 |
|
| £65-70K |
0.39% |
0.91% |
42.97 |
|
| £70-75K |
0.29% |
0.72% |
40.57 |
|
| £75-80K |
0.22% |
0.57% |
38.41 |
|
| £80-85K |
0.17% |
0.46% |
36.44 |
|
| £85-90K |
0.13% |
0.37% |
34.65 |
|
| £90-95K |
0.10% |
0.31% |
33.01 |
|
| £95-100K |
0.08% |
0.25% |
31.50 |
|
| £100K + |
0.33% |
1.34% |
24.33 |
|
|
|

|


|
1992-1997
|
1997-2001
|
|
|
|
| Con |
-9.62% |
| Lab |
9.78% |
| LD |
-3.69% |
|
| Con |
0.76% |
| Lab |
-4.53% |
| LD |
3.20% |
|
|
 |
George Mudie
Labour hold
|
| Con |
 |
5,647 |
19.44% |
| Lab |
 |
18,290 |
62.95% |
| LD |
 |
3,923 |
13.50% |
| Oth |
 |
1,195 |
4.11% |
| Maj |
 |
12,643 |
43.51% |
| Turn |
 |
29,055 |
51.52% |
|
|
 |
George Mudie
Labour hold
|
| C |
Barry Anderson |
5,647 |
19.44% |
| LD |
Brian Jennings |
3,923 |
13.50% |
| SL |
Mark King |
419 |
1.44% |
| L |
George Mudie |
18,290 |
62.95% |
| UK |
Raymond Northgreaves |
634 |
2.18% |
| I |
Peter Socrates |
142 |
0.49% |
|
Candidates representing 6 parties stood for election to this seat.
|
|
 |
George Mudie
Labour
|
| Con |
 |
6,685 |
18.68% |
| Lab |
 |
24,151 |
67.48% |
| LD |
 |
3,689 |
10.31% |
| Ref |
 |
1,267 |
3.54% |
| Oth |
|
0 |
0.00% |
| Maj |
 |
17,466 |
48.80% |
| Turn |
 |
35,792 |
62.83% |
|
|
 |
|
Labour
|
| Con |
 |
12,232 |
28.30% |
| Lab |
 |
24,929 |
57.70% |
| LD |
 |
6,040 |
14.00% |
| Oth |
|
0 |
0.00% |
| Maj |
 |
12,697 |
29.40% |
| Turn |
 |
43,201 |
69.60% |
|
|
 |
|

|

