|
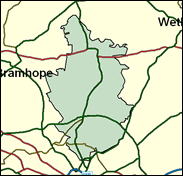
Leeds North East
Labour hold

This formerly solid, and middle class, Leeds seat is swinging in the long term to Labour as its demographic make-up changes, with the inner city marching ever closer and the more affluent fleeing outwards from the city centre. Even in a relatively poor year for Labour for recent times, their candidates received approximately the same number of votes as the Tories in the May 2000 local elections here - and this is discounting the strong performance of a "Left Alliance" candidate in the Labour stronghold of Chapel Allerton ward. Fabian Hamilton is favourite to hold on for at least one more term.

Fabian Hamilton was elected in 1997 after a bitter selection process involving the barring by Labour’s NEC of the hard left candidate Liz Davies. Black-bearded, born 1955 and son of a judge, he was educated at Brentwood School and York University. His parliamentary career has been less eventful than his selection, with his Jewish background reflected in his concern for the Middle East peace process. Described by a fellow Leeds MP as “a brilliant speaker, but a terrible businessman”, he has worked in graphic design and computing, and served eleven years on Leeds Council.
 |
| Wealthy Achievers, Suburban Areas |
35.40% |
14.99% |
236.14 |
|
| Affluent Greys, Rural Communities |
0.00% |
2.13% |
0.00 |
|
| Prosperous Pensioners, Retirement Areas |
4.27% |
2.49% |
171.65 |
|
| Affluent Executives, Family Areas |
2.04% |
4.43% |
46.21 |
|
| Well-Off Workers, Family Areas |
1.87% |
7.27% |
25.65 |
|
| Affluent Urbanites, Town & City Areas |
3.42% |
2.56% |
133.38 |
|
| Prosperous Professionals, Metropolitan Areas |
2.13% |
2.04% |
104.34 |
|
| Better-Off Executives, Inner City Areas |
3.30% |
3.94% |
83.68 |
|
| Comfortable Middle Agers, Mature Home Owning Areas |
16.27% |
13.04% |
124.75 |
|
| Skilled Workers, Home Owning Areas |
0.52% |
12.70% |
4.06 |
|
| New Home Owners, Mature Communities |
2.62% |
8.14% |
32.14 |
|
| White Collar Workers, Better-Off Multi Ethnic Areas |
9.93% |
4.02% |
246.98 |
|
| Older People, Less Prosperous Areas |
2.43% |
3.19% |
76.22 |
|
| Council Estate Residents, Better-Off Homes |
3.81% |
11.31% |
33.70 |
|
| Council Estate Residents, High Unemployment |
4.47% |
3.06% |
146.03 |
|
| Council Estate Residents, Greatest Hardship |
1.28% |
2.52% |
50.89 |
|
| People in Multi-Ethnic, Low-Income Areas |
6.24% |
2.10% |
297.20 |
|
| Unclassified |
0.00% |
0.06% |
0.00 |
|
|
 |
 |
 |
| £0-5K |
8.57% |
9.41% |
90.99 |
|
| £5-10K |
14.40% |
16.63% |
86.59 |
|
| £10-15K |
14.79% |
16.58% |
89.24 |
|
| £15-20K |
12.79% |
13.58% |
94.16 |
|
| £20-25K |
10.37% |
10.39% |
99.74 |
|
| £25-30K |
8.18% |
7.77% |
105.25 |
|
| £30-35K |
6.39% |
5.79% |
110.40 |
|
| £35-40K |
4.98% |
4.33% |
115.05 |
|
| £40-45K |
3.89% |
3.27% |
119.19 |
|
| £45-50K |
3.05% |
2.48% |
122.82 |
|
| £50-55K |
2.40% |
1.90% |
125.98 |
|
| £55-60K |
1.90% |
1.47% |
128.71 |
|
| £60-65K |
1.51% |
1.15% |
131.05 |
|
| £65-70K |
1.21% |
0.91% |
133.04 |
|
| £70-75K |
0.97% |
0.72% |
134.73 |
|
| £75-80K |
0.78% |
0.57% |
136.14 |
|
| £80-85K |
0.64% |
0.46% |
137.32 |
|
| £85-90K |
0.52% |
0.37% |
138.29 |
|
| £90-95K |
0.42% |
0.31% |
139.07 |
|
| £95-100K |
0.35% |
0.25% |
139.69 |
|
| £100K + |
1.88% |
1.34% |
139.55 |
|
|
|

|


|
1992-1997
|
1997-2001
|
|
|
|
| Con |
-11.54% |
| Lab |
12.35% |
| LD |
-2.82% |
|
| Con |
-2.55% |
| Lab |
-0.02% |
| LD |
2.02% |
|
|
 |
Fabian Hamilton
Labour hold
|
| Con |
 |
12,451 |
31.31% |
| Lab |
 |
19,540 |
49.13% |
| LD |
 |
6,325 |
15.90% |
| Oth |
 |
1,457 |
3.66% |
| Maj |
 |
7,089 |
17.82% |
| Turn |
 |
39,773 |
62.03% |
|
|
 |
Fabian Hamilton
Labour hold
|
| LD |
Jonathan Brown |
6,325 |
15.90% |
| Left All |
Celia Foote |
770 |
1.94% |
| L |
Fabian Hamilton |
19,540 |
49.13% |
| UK |
Jeffrey Miles |
382 |
0.96% |
| SL |
Colin Muir |
173 |
0.43% |
| C |
Owain Rhys |
12,451 |
31.31% |
| I |
Mohammed Zaman |
132 |
0.33% |
|
Candidates representing 7 parties stood for election to this seat.
|
|
 |
Fabian Hamilton
Labour gain
|
| Con |
 |
15,409 |
33.86% |
| Lab |
 |
22,368 |
49.15% |
| LD |
 |
6,318 |
13.88% |
| Ref |
 |
946 |
2.08% |
| Oth |
 |
468 |
1.03% |
| Maj |
 |
6,959 |
15.29% |
| Turn |
 |
45,509 |
72.03% |
|
|
 |
|
Conservative
|
| Con |
 |
22,462 |
45.40% |
| Lab |
 |
18,218 |
36.80% |
| LD |
 |
8,274 |
16.70% |
| Oth |
 |
546 |
1.10% |
| Maj |
 |
4,244 |
8.60% |
| Turn |
 |
49,500 |
76.06% |
|
|
 |
|

|

