|
Leeds North West
Labour hold

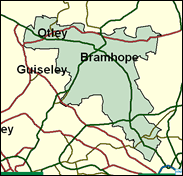
This is the most vulnerable of the "Leeds" seats to a recapture by the Conservatives, not least because it extends all the way beyond the traditional borders of the city to include a ward named Otley and Wharfedale, but it will remain close and divided as the sitting MP Harold Best can rely on doing well further in at Headingley, where he himself lives, among a swarm of students, and to some extent in Weetwood. He will probably win again if Labour has an overall majority above 90 (half that of last time) but not otherwise.

Harold Best, a bald and bearded, secondary modern and technical college-educated electrician, was unexpectedly catapulted into Westminster in his 60th year in 1997. Subsequently he confirmed his un-Blairite credentials by rebelling against lone parent benefit cuts, the predatory pricing of the Murdoch press, the Criminal Justice (Terrorism & Conspiracy) Bill, the Prime Minister’s power to nominate life peers, and disability benefit cuts. The Conservative hoping to regain this seat is Harrogate-based Adam Pritchard, a marketing manager with a car component firm, who was born in 1967 and educated at King Henry VIII School, Coventry, University College London, and Leeds University Business School. He was active in the past in the Federation of Conservative Students and in Lady Olga Maitland’s Women and Families for Defence.
 |
| Wealthy Achievers, Suburban Areas |
20.99% |
14.99% |
140.00 |
|
| Affluent Greys, Rural Communities |
0.00% |
2.13% |
0.00 |
|
| Prosperous Pensioners, Retirement Areas |
2.31% |
2.49% |
93.11 |
|
| Affluent Executives, Family Areas |
2.38% |
4.43% |
53.88 |
|
| Well-Off Workers, Family Areas |
4.73% |
7.27% |
64.98 |
|
| Affluent Urbanites, Town & City Areas |
6.86% |
2.56% |
267.32 |
|
| Prosperous Professionals, Metropolitan Areas |
2.51% |
2.04% |
123.02 |
|
| Better-Off Executives, Inner City Areas |
20.82% |
3.94% |
527.92 |
|
| Comfortable Middle Agers, Mature Home Owning Areas |
13.26% |
13.04% |
101.71 |
|
| Skilled Workers, Home Owning Areas |
5.02% |
12.70% |
39.49 |
|
| New Home Owners, Mature Communities |
6.64% |
8.14% |
81.54 |
|
| White Collar Workers, Better-Off Multi Ethnic Areas |
5.04% |
4.02% |
125.22 |
|
| Older People, Less Prosperous Areas |
5.38% |
3.19% |
168.97 |
|
| Council Estate Residents, Better-Off Homes |
1.70% |
11.31% |
14.99 |
|
| Council Estate Residents, High Unemployment |
2.28% |
3.06% |
74.39 |
|
| Council Estate Residents, Greatest Hardship |
0.00% |
2.52% |
0.00 |
|
| People in Multi-Ethnic, Low-Income Areas |
0.03% |
2.10% |
1.50 |
|
| Unclassified |
0.06% |
0.06% |
90.35 |
|
|
 |
 |
 |
| £0-5K |
9.34% |
9.41% |
99.20 |
|
| £5-10K |
14.98% |
16.63% |
90.04 |
|
| £10-15K |
15.10% |
16.58% |
91.10 |
|
| £15-20K |
12.85% |
13.58% |
94.58 |
|
| £20-25K |
10.26% |
10.39% |
98.70 |
|
| £25-30K |
7.99% |
7.77% |
102.82 |
|
| £30-35K |
6.18% |
5.79% |
106.70 |
|
| £35-40K |
4.78% |
4.33% |
110.26 |
|
| £40-45K |
3.70% |
3.27% |
113.45 |
|
| £45-50K |
2.89% |
2.48% |
116.31 |
|
| £50-55K |
2.26% |
1.90% |
118.84 |
|
| £55-60K |
1.79% |
1.47% |
121.08 |
|
| £60-65K |
1.42% |
1.15% |
123.06 |
|
| £65-70K |
1.13% |
0.91% |
124.81 |
|
| £70-75K |
0.91% |
0.72% |
126.34 |
|
| £75-80K |
0.73% |
0.57% |
127.69 |
|
| £80-85K |
0.60% |
0.46% |
128.87 |
|
| £85-90K |
0.49% |
0.37% |
129.90 |
|
| £90-95K |
0.40% |
0.31% |
130.81 |
|
| £95-100K |
0.33% |
0.25% |
131.60 |
|
| £100K + |
1.80% |
1.34% |
133.87 |
|
|
|

|


|
1992-1997
|
1997-2001
|
|
|
|
| Con |
-10.90% |
| Lab |
12.59% |
| LD |
-4.13% |
|
| Con |
-2.52% |
| Lab |
2.03% |
| LD |
3.25% |
|
|
 |
Harold Best
Labour hold
|
| Con |
 |
12,558 |
29.58% |
| Lab |
 |
17,794 |
41.92% |
| LD |
 |
11,431 |
26.93% |
| Oth |
 |
668 |
1.57% |
| Maj |
 |
5,236 |
12.33% |
| Turn |
 |
42,451 |
58.20% |
|
|
 |
Harold Best
Labour hold
|
| L |
Harold Best |
17,794 |
41.92% |
| LD |
David Hall-Matthews |
11,431 |
26.93% |
| UK |
Simon Jones |
668 |
1.57% |
| C |
Adam Pritchard |
12,558 |
29.58% |
|
Candidates representing 4 parties stood for election to this seat.
|
|
 |
Harold Best
Labour gain
|
| Con |
 |
15,850 |
32.10% |
| Lab |
 |
19,694 |
39.89% |
| LD |
 |
11,689 |
23.67% |
| Ref |
 |
1,325 |
2.68% |
| Oth |
 |
818 |
1.66% |
| Maj |
 |
3,844 |
7.79% |
| Turn |
 |
49,376 |
70.57% |
|
|
 |
|
Conservative
|
| Con |
 |
21,750 |
43.00% |
| Lab |
 |
13,782 |
27.30% |
| LD |
 |
14,079 |
27.80% |
| Oth |
 |
946 |
1.90% |
| Maj |
 |
7,671 |
15.20% |
| Turn |
 |
50,557 |
73.55% |
|
|
 |
|

|

