|
Beaconsfield
Conservative hold

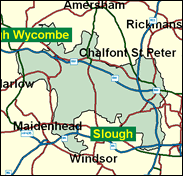
Buckinghamshire is one of the most Conservative counties, always held by the Tories even at local level and even in dire midterm years such as 1985 and 1993. The southern tip of the county is probably its most Conservative section. Here we have some of the highest property values in the UK outside London, not far from the M4 and M40 and Heathrow Airport, in towns such as Gerrards Cross and Beaconsfield itself - which is probably best described as downright wealthy. In the 1982 by-election here a few prescient observers noticed the professionalism and clean cut attractiveness of the young barrister who was Labour candidate, one Tony Blair. He obtained 3,886 votes. Whatever the success of his plans to win at least two thumping majorities, Mr Blair's party will never win Beaconsfield.

Dominic Grieve, a half-French, Churchy barrister, is, as the son of Percy Grieve QC, MP for Solihull 1964-83, one of 19 sons or daughters of MPs elected to the Commons in 1997. Beaky-nosed, with plastered-down hair and a precise manner, he has opposed Scottish devolution, called for a directly elected House of Lords and expressed concern at traffic congestion on the three motorways that traverse his constituency. His Scottish roots landed him with a Scottish frontbench spokesmanship in 1999.
 |
| Wealthy Achievers, Suburban Areas |
50.82% |
14.99% |
338.95 |
|
| Affluent Greys, Rural Communities |
0.13% |
2.13% |
6.29 |
|
| Prosperous Pensioners, Retirement Areas |
1.74% |
2.49% |
69.83 |
|
| Affluent Executives, Family Areas |
5.59% |
4.43% |
126.27 |
|
| Well-Off Workers, Family Areas |
7.61% |
7.27% |
104.64 |
|
| Affluent Urbanites, Town & City Areas |
3.44% |
2.56% |
134.20 |
|
| Prosperous Professionals, Metropolitan Areas |
1.31% |
2.04% |
64.11 |
|
| Better-Off Executives, Inner City Areas |
0.03% |
3.94% |
0.83 |
|
| Comfortable Middle Agers, Mature Home Owning Areas |
19.85% |
13.04% |
152.21 |
|
| Skilled Workers, Home Owning Areas |
2.42% |
12.70% |
19.02 |
|
| New Home Owners, Mature Communities |
4.08% |
8.14% |
50.12 |
|
| White Collar Workers, Better-Off Multi Ethnic Areas |
0.23% |
4.02% |
5.68 |
|
| Older People, Less Prosperous Areas |
1.39% |
3.19% |
43.71 |
|
| Council Estate Residents, Better-Off Homes |
1.24% |
11.31% |
11.00 |
|
| Council Estate Residents, High Unemployment |
0.11% |
3.06% |
3.52 |
|
| Council Estate Residents, Greatest Hardship |
0.00% |
2.52% |
0.00 |
|
| People in Multi-Ethnic, Low-Income Areas |
0.00% |
2.10% |
0.00 |
|
| Unclassified |
0.01% |
0.06% |
19.19 |
|
|
 |
 |
 |
| £0-5K |
3.45% |
9.41% |
36.68 |
|
| £5-10K |
7.82% |
16.63% |
47.00 |
|
| £10-15K |
10.34% |
16.58% |
62.37 |
|
| £15-20K |
10.88% |
13.58% |
80.06 |
|
| £20-25K |
10.26% |
10.39% |
98.77 |
|
| £25-30K |
9.15% |
7.77% |
117.66 |
|
| £30-35K |
7.89% |
5.79% |
136.22 |
|
| £35-40K |
6.68% |
4.33% |
154.07 |
|
| £40-45K |
5.58% |
3.27% |
171.02 |
|
| £45-50K |
4.64% |
2.48% |
186.93 |
|
| £50-55K |
3.84% |
1.90% |
201.77 |
|
| £55-60K |
3.18% |
1.47% |
215.53 |
|
| £60-65K |
2.63% |
1.15% |
228.22 |
|
| £65-70K |
2.17% |
0.91% |
239.88 |
|
| £70-75K |
1.80% |
0.72% |
250.58 |
|
| £75-80K |
1.50% |
0.57% |
260.37 |
|
| £80-85K |
1.25% |
0.46% |
269.30 |
|
| £85-90K |
1.04% |
0.37% |
277.43 |
|
| £90-95K |
0.87% |
0.31% |
284.83 |
|
| £95-100K |
0.73% |
0.25% |
291.55 |
|
| £100K + |
4.26% |
1.34% |
317.14 |
|
|
|

|


|
1992-1997
|
1997-2001
|
|
|
|
| Con |
-14.48% |
| Lab |
6.35% |
| LD |
1.96% |
|
| Con |
1.18% |
| Lab |
2.79% |
| LD |
1.35% |
|
|
 |
Dominic Grieve
Conservative hold
|
| Con |
 |
20,233 |
50.40% |
| Lab |
 |
9,168 |
22.84% |
| LD |
 |
9,117 |
22.71% |
| Oth |
 |
1,626 |
4.05% |
| Maj |
 |
11,065 |
27.56% |
| Turn |
 |
40,144 |
58.71% |
|
|
 |
Dominic Grieve
Conservative hold
|
| C |
Dominic Grieve |
20,233 |
50.40% |
| L |
Stephen Lathrope |
9,168 |
22.84% |
| LD |
Stephen Lloyd |
9,117 |
22.71% |
| UK |
Andrew Moffatt |
1,626 |
4.05% |
|
Candidates representing 4 parties stood for election to this seat.
|
|
 |
Dominic Grieve
Conservative
|
| Con |
 |
24,709 |
49.22% |
| Lab |
 |
10,063 |
20.05% |
| LD |
 |
10,722 |
21.36% |
| Ref |
 |
2,197 |
4.38% |
| Oth |
 |
2,510 |
5.00% |
| Maj |
 |
13,987 |
27.86% |
| Turn |
 |
50,201 |
72.80% |
|
|
 |
|
Conservative
|
| Con |
 |
34,316 |
63.70% |
| Lab |
 |
7,371 |
13.70% |
| LD |
 |
10,452 |
19.40% |
| Oth |
 |
1,697 |
3.20% |
| Maj |
 |
23,864 |
44.30% |
| Turn |
 |
53,836 |
78.30% |
|
|
 |
|

|

