|
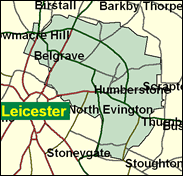
Leicester East
Labour hold

In December 2000 Leicester received some possibly misconceived publicity as the first town in Britain about to become majority non-white. Actually this was based on projections to the 2011 Census, assuming continued reproduction and (non-)migration patterns, and ignores those London boroughs of a comparable population which are likely to pass the 50pc mark in the 2001 Census (Newham and Brent), and also the very large population of Greater Leicester which lies outside the city boundaries as presently drawn. Nevertheless, the massive influence of Asian communities cannot be denied, particularly in the East seat (represented by Keith Vaz) and South, and this has played a large role of converting both of these into safe Labour seats in all conceivable future circumstances.

Keith Vaz, the first Asian Minister since the first ever - Lord Sinha in 1919 - was elected in here in 1987. Self-presented as the Asian community’s leading politician, he is a public school (Latymer Upper) and Cambridge (Gonville & Caius)-educated solicitor-turned-barrister, born (1956) in Aden of Goan Catholic parents, and so shares with the rest of the albeit diverse British Asian community at least the colour of his skin. A smooth and skilled weaver amongst the orthodoxies as in his variable private and public utterances on Rushdie’s Satanic Verses, his ministerial career was delayed by allegations of involvement in in-fighting in local Leicester politics, but by 1999 he was, as Minister for Europe, a barn door target for Tory Europhobia. While his oleaginous perambulations through the Asian business community invited Tory allegations during the Hinduja passport affair, his professed liking for his old school hymn ‘Jerusalem’ must furrow brows among the Asian diaspora. Under pressure, he collapsed in March and withdrew from the media spotlight.
 |
| Wealthy Achievers, Suburban Areas |
3.80% |
14.99% |
25.37 |
|
| Affluent Greys, Rural Communities |
0.00% |
2.13% |
0.00 |
|
| Prosperous Pensioners, Retirement Areas |
0.89% |
2.49% |
35.63 |
|
| Affluent Executives, Family Areas |
1.18% |
4.43% |
26.57 |
|
| Well-Off Workers, Family Areas |
0.87% |
7.27% |
11.92 |
|
| Affluent Urbanites, Town & City Areas |
0.37% |
2.56% |
14.25 |
|
| Prosperous Professionals, Metropolitan Areas |
0.00% |
2.04% |
0.00 |
|
| Better-Off Executives, Inner City Areas |
0.68% |
3.94% |
17.17 |
|
| Comfortable Middle Agers, Mature Home Owning Areas |
5.65% |
13.04% |
43.31 |
|
| Skilled Workers, Home Owning Areas |
13.59% |
12.70% |
107.01 |
|
| New Home Owners, Mature Communities |
6.78% |
8.14% |
83.32 |
|
| White Collar Workers, Better-Off Multi Ethnic Areas |
0.33% |
4.02% |
8.13 |
|
| Older People, Less Prosperous Areas |
4.37% |
3.19% |
137.08 |
|
| Council Estate Residents, Better-Off Homes |
50.76% |
11.31% |
448.75 |
|
| Council Estate Residents, High Unemployment |
3.85% |
3.06% |
125.75 |
|
| Council Estate Residents, Greatest Hardship |
3.69% |
2.52% |
146.62 |
|
| People in Multi-Ethnic, Low-Income Areas |
3.21% |
2.10% |
152.63 |
|
| Unclassified |
0.00% |
0.06% |
0.00 |
|
|
 |
 |
 |
| £0-5K |
15.46% |
9.41% |
164.20 |
|
| £5-10K |
23.78% |
16.63% |
142.97 |
|
| £10-15K |
20.07% |
16.58% |
121.03 |
|
| £15-20K |
13.91% |
13.58% |
102.37 |
|
| £20-25K |
9.06% |
10.39% |
87.21 |
|
| £25-30K |
5.83% |
7.77% |
75.00 |
|
| £30-35K |
3.77% |
5.79% |
65.15 |
|
| £35-40K |
2.48% |
4.33% |
57.14 |
|
| £40-45K |
1.65% |
3.27% |
50.56 |
|
| £45-50K |
1.12% |
2.48% |
45.11 |
|
| £50-55K |
0.77% |
1.90% |
40.56 |
|
| £55-60K |
0.54% |
1.47% |
36.72 |
|
| £60-65K |
0.39% |
1.15% |
33.46 |
|
| £65-70K |
0.28% |
0.91% |
30.66 |
|
| £70-75K |
0.20% |
0.72% |
28.25 |
|
| £75-80K |
0.15% |
0.57% |
26.15 |
|
| £80-85K |
0.11% |
0.46% |
24.31 |
|
| £85-90K |
0.08% |
0.37% |
22.69 |
|
| £90-95K |
0.06% |
0.31% |
21.26 |
|
| £95-100K |
0.05% |
0.25% |
19.99 |
|
| £100K + |
0.20% |
1.34% |
14.81 |
|
|
|

|


|
1992-1997
|
1997-2001
|
|
|
|
| Con |
-9.69% |
| Lab |
9.20% |
| LD |
-1.11% |
|
| Con |
0.49% |
| Lab |
-7.95% |
| LD |
5.28% |
|
|
 |
Keith Vaz
Labour hold
|
| Con |
 |
9,960 |
24.50% |
| Lab |
 |
23,402 |
57.55% |
| LD |
 |
4,989 |
12.27% |
| Oth |
 |
2,310 |
5.68% |
| Maj |
 |
13,442 |
33.06% |
| Turn |
 |
40,661 |
62.05% |
|
|
 |
Keith Vaz
Labour hold
|
| LD |
Harpinder Athwal |
4,989 |
12.27% |
| I |
Shirley Bennett |
701 |
1.72% |
| C |
John Mugglestone |
9,960 |
24.50% |
| BNP |
Clive Potter |
772 |
1.90% |
| SL |
Dave Roberts |
837 |
2.06% |
| L |
Keith Vaz |
23,402 |
57.55% |
|
Candidates representing 6 parties stood for election to this seat.
|
|
 |
Keith Vaz
Labour
|
| Con |
 |
10,661 |
24.01% |
| Lab |
 |
29,083 |
65.50% |
| LD |
 |
3,105 |
6.99% |
| Ref |
 |
1,015 |
2.29% |
| Oth |
 |
538 |
1.21% |
| Maj |
 |
18,422 |
41.49% |
| Turn |
 |
44,402 |
69.37% |
|
|
 |
|
Labour
|
| Con |
 |
16,807 |
33.70% |
| Lab |
 |
28,123 |
56.30% |
| LD |
 |
4,043 |
8.10% |
| Oth |
 |
947 |
1.90% |
| Maj |
 |
11,316 |
22.70% |
| Turn |
 |
49,920 |
77.88% |
|
|
 |
|

|

