|
Leicester South
Labour hold

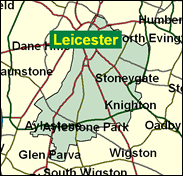
Once a cliff edge marginal (when Derek Spencer beat Jim Marshall to win the seat for the Conservatives by seven votes in the last result to be declared in the 1983 General Election), South is now just one of three very safe Labour constituencies within the boundaries of the east Midlands city of Leicester. It still includes the middle class housing along the A6 to the south east, especially in Knighton, but the tome is now more given by the ethnic majority wards of Spinney Hill (82 pc non-white at the time of the 1991 Census), Crown Hills (76pc and recently blighted by a serious outbreak of tuberculosis) and Wycliffe; these are situated near to the city centre, which is also within the boundaries of South.

Jim Marshall, a rough-hewn former polytechnic lecturer, elected here - with inerruptions - since 1974 (he was out from 1983-87) rose quickly in four years as a Leicester City councillor to become its leader before election as a local MP. Born 1941 and educated at Sheffield City Grammar School and Leeds University, he was dropped by Smith as a frontbencher on Northern Ireland in 1992, voted for Beckett not Blair in 1994, and rebelled 24 times against the Whips in the 1992-97 Parliament, often over Europe. Scurrilously tabloid-linked to Clare Short in 1997, passé and quiet, he is out-gunned in Leicester by ministerial neighbours, Keith Vaz and Patricia Hewitt. He has rebelled against the Government on student fees, incapacity benefit, legal aid cuts, pensions and freedom of information.
 |
| Wealthy Achievers, Suburban Areas |
8.08% |
14.99% |
53.87 |
|
| Affluent Greys, Rural Communities |
0.10% |
2.13% |
4.85 |
|
| Prosperous Pensioners, Retirement Areas |
1.38% |
2.49% |
55.32 |
|
| Affluent Executives, Family Areas |
0.00% |
4.43% |
0.00 |
|
| Well-Off Workers, Family Areas |
1.28% |
7.27% |
17.67 |
|
| Affluent Urbanites, Town & City Areas |
1.92% |
2.56% |
74.93 |
|
| Prosperous Professionals, Metropolitan Areas |
0.38% |
2.04% |
18.40 |
|
| Better-Off Executives, Inner City Areas |
11.80% |
3.94% |
299.12 |
|
| Comfortable Middle Agers, Mature Home Owning Areas |
5.11% |
13.04% |
39.19 |
|
| Skilled Workers, Home Owning Areas |
10.11% |
12.70% |
79.57 |
|
| New Home Owners, Mature Communities |
4.99% |
8.14% |
61.26 |
|
| White Collar Workers, Better-Off Multi Ethnic Areas |
9.39% |
4.02% |
233.56 |
|
| Older People, Less Prosperous Areas |
1.62% |
3.19% |
51.01 |
|
| Council Estate Residents, Better-Off Homes |
20.03% |
11.31% |
177.06 |
|
| Council Estate Residents, High Unemployment |
6.43% |
3.06% |
209.96 |
|
| Council Estate Residents, Greatest Hardship |
6.64% |
2.52% |
263.58 |
|
| People in Multi-Ethnic, Low-Income Areas |
10.74% |
2.10% |
511.23 |
|
| Unclassified |
0.01% |
0.06% |
20.09 |
|
|
 |
 |
 |
| £0-5K |
14.01% |
9.41% |
148.82 |
|
| £5-10K |
21.20% |
16.63% |
127.45 |
|
| £10-15K |
18.49% |
16.58% |
111.53 |
|
| £15-20K |
13.50% |
13.58% |
99.36 |
|
| £20-25K |
9.35% |
10.39% |
89.97 |
|
| £25-30K |
6.43% |
7.77% |
82.65 |
|
| £30-35K |
4.45% |
5.79% |
76.88 |
|
| £35-40K |
3.13% |
4.33% |
72.29 |
|
| £40-45K |
2.24% |
3.27% |
68.58 |
|
| £45-50K |
1.63% |
2.48% |
65.55 |
|
| £50-55K |
1.20% |
1.90% |
63.04 |
|
| £55-60K |
0.90% |
1.47% |
60.94 |
|
| £60-65K |
0.68% |
1.15% |
59.17 |
|
| £65-70K |
0.52% |
0.91% |
57.65 |
|
| £70-75K |
0.41% |
0.72% |
56.35 |
|
| £75-80K |
0.32% |
0.57% |
55.23 |
|
| £80-85K |
0.25% |
0.46% |
54.24 |
|
| £85-90K |
0.20% |
0.37% |
53.38 |
|
| £90-95K |
0.16% |
0.31% |
52.62 |
|
| £95-100K |
0.13% |
0.25% |
51.94 |
|
| £100K + |
0.66% |
1.34% |
49.13 |
|
|
|

|


|
1992-1997
|
1997-2001
|
|
|
|
| Con |
-10.86% |
| Lab |
5.72% |
| LD |
2.13% |
|
| Con |
-0.68% |
| Lab |
-3.54% |
| LD |
3.36% |
|
|
 |
Jim Marshall
Labour hold
|
| Con |
 |
9,715 |
23.05% |
| Lab |
 |
22,958 |
54.48% |
| LD |
 |
7,243 |
17.19% |
| Oth |
 |
2,226 |
5.28% |
| Maj |
 |
13,243 |
31.42% |
| Turn |
 |
42,142 |
57.99% |
|
|
 |
Jim Marshall
Labour hold
|
| SL |
Arnold Gardner |
676 |
1.60% |
| C |
Richard Hoile |
9,715 |
23.05% |
| UK |
Kirti Ladwa |
333 |
0.79% |
| G |
Margaret Layton |
1,217 |
2.89% |
| L |
Jim Marshall |
22,958 |
54.48% |
| LD |
Parmjit Singh Gill |
7,243 |
17.19% |
|
Candidates representing 6 parties stood for election to this seat.
|
|
 |
James Marshall
Labour
|
| Con |
 |
11,421 |
23.74% |
| Lab |
 |
27,914 |
58.02% |
| LD |
 |
6,654 |
13.83% |
| Ref |
 |
1,184 |
2.46% |
| Oth |
 |
941 |
1.96% |
| Maj |
 |
16,493 |
34.28% |
| Turn |
 |
48,114 |
67.06% |
|
|
 |
|
Labour
|
| Con |
 |
18,494 |
34.60% |
| Lab |
 |
27,934 |
52.30% |
| LD |
 |
6,271 |
11.70% |
| Oth |
 |
708 |
1.30% |
| Maj |
 |
9,440 |
17.70% |
| Turn |
 |
53,407 |
74.44% |
|
|
 |
|

|

