|
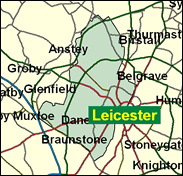
Leicester West
Labour hold

Leicester West differs from East and South in that it is by far the most working class of the three seats, and it also has the highest proportion of council housing (just over a third in 1991) in large estates like North Braunstone and Mowmacre. However - and this is not as unconnected with the previous facts as might be thought - it is also by far the least non-white. This is Leicester's white working class seat, and it is the least strongly Labour. Before the impact of race on Leicester's political makeup it was the most. However, the gap is closing, perhaps as new Labour is not as left wing as the old variety. There were two far left wing socialist candidates here in 1997, and two from the far right; the four of them managed to notch up about 3pc altogether.

Patricia Hewitt, Minister of State at the DTI, is the fastest-rising of a clutch of metropolitan women contemporaries (including Margaret Hodge, Tessa Jowell, but no longer Harriet Harman). Born 1948 into the Australian political establishment (as daughter of Sir Lennox Hewitt, leading civil servant in the Prime Minister’s Office), she attended the Church of England Girls’ School, Canberra, ANU and Newnham College, Cambridge, then rose politically as head of the NCCL, aide to Neil Kinnock (co-drafting his 1985 Militant-bashing oration), and deputy head of the think-tank IPPR, before increasing her disposable income with three years at Anderson Consulting. Small, intense and humourless, with a patronising in-your-face deliberately articulated mode of speech, she has inspired in one Labour MP the observation that he would prefer Norman Tebbit as a desert island cohabitee.
 |
| Wealthy Achievers, Suburban Areas |
2.84% |
14.99% |
18.93 |
|
| Affluent Greys, Rural Communities |
0.00% |
2.13% |
0.00 |
|
| Prosperous Pensioners, Retirement Areas |
0.00% |
2.49% |
0.00 |
|
| Affluent Executives, Family Areas |
1.09% |
4.43% |
24.56 |
|
| Well-Off Workers, Family Areas |
5.04% |
7.27% |
69.32 |
|
| Affluent Urbanites, Town & City Areas |
1.14% |
2.56% |
44.47 |
|
| Prosperous Professionals, Metropolitan Areas |
0.00% |
2.04% |
0.00 |
|
| Better-Off Executives, Inner City Areas |
6.97% |
3.94% |
176.78 |
|
| Comfortable Middle Agers, Mature Home Owning Areas |
2.45% |
13.04% |
18.82 |
|
| Skilled Workers, Home Owning Areas |
23.93% |
12.70% |
188.38 |
|
| New Home Owners, Mature Communities |
8.08% |
8.14% |
99.28 |
|
| White Collar Workers, Better-Off Multi Ethnic Areas |
3.28% |
4.02% |
81.65 |
|
| Older People, Less Prosperous Areas |
1.23% |
3.19% |
38.54 |
|
| Council Estate Residents, Better-Off Homes |
29.83% |
11.31% |
263.73 |
|
| Council Estate Residents, High Unemployment |
3.91% |
3.06% |
127.65 |
|
| Council Estate Residents, Greatest Hardship |
10.20% |
2.52% |
405.09 |
|
| People in Multi-Ethnic, Low-Income Areas |
0.00% |
2.10% |
0.00 |
|
| Unclassified |
0.00% |
0.06% |
0.00 |
|
|
 |
 |
 |
| £0-5K |
15.69% |
9.41% |
166.71 |
|
| £5-10K |
23.77% |
16.63% |
142.89 |
|
| £10-15K |
19.96% |
16.58% |
120.40 |
|
| £15-20K |
13.81% |
13.58% |
101.63 |
|
| £20-25K |
8.99% |
10.39% |
86.50 |
|
| £25-30K |
5.78% |
7.77% |
74.39 |
|
| £30-35K |
3.75% |
5.79% |
64.68 |
|
| £35-40K |
2.46% |
4.33% |
56.83 |
|
| £40-45K |
1.65% |
3.27% |
50.44 |
|
| £45-50K |
1.12% |
2.48% |
45.18 |
|
| £50-55K |
0.78% |
1.90% |
40.82 |
|
| £55-60K |
0.55% |
1.47% |
37.15 |
|
| £60-65K |
0.39% |
1.15% |
34.05 |
|
| £65-70K |
0.28% |
0.91% |
31.40 |
|
| £70-75K |
0.21% |
0.72% |
29.12 |
|
| £75-80K |
0.16% |
0.57% |
27.15 |
|
| £80-85K |
0.12% |
0.46% |
25.42 |
|
| £85-90K |
0.09% |
0.37% |
23.90 |
|
| £90-95K |
0.07% |
0.31% |
22.55 |
|
| £95-100K |
0.05% |
0.25% |
21.35 |
|
| £100K + |
0.22% |
1.34% |
16.38 |
|
|
|

|


|
1992-1997
|
1997-2001
|
|
|
|
| Con |
-14.75% |
| Lab |
8.39% |
| LD |
0.86% |
|
| Con |
1.46% |
| Lab |
-0.96% |
| LD |
1.14% |
|
|
 |
Patricia Hewitt
Labour hold
|
| Con |
 |
8,375 |
25.21% |
| Lab |
 |
18,014 |
54.23% |
| LD |
 |
5,085 |
15.31% |
| Oth |
 |
1,745 |
5.25% |
| Maj |
 |
9,639 |
29.02% |
| Turn |
 |
33,219 |
46.75% |
|
|
 |
Patricia Hewitt
Labour hold
|
| G |
Matthew Gough |
1,074 |
3.23% |
| L |
Patricia Hewitt |
18,014 |
54.23% |
| SL |
Sean Kirkpatrick |
350 |
1.05% |
| SA |
Steve Score |
321 |
0.97% |
| C |
Chris Shaw |
8,375 |
25.21% |
| LD |
Andrew Vincent |
5,085 |
15.31% |
|
Candidates representing 6 parties stood for election to this seat.
|
|
 |
Patricia Hewitt
Labour
|
| Con |
 |
9,716 |
23.75% |
| Lab |
 |
22,580 |
55.19% |
| LD |
 |
5,795 |
14.16% |
| Ref |
 |
970 |
2.37% |
| Oth |
 |
1,853 |
4.53% |
| Maj |
 |
12,864 |
31.44% |
| Turn |
 |
40,914 |
63.36% |
|
|
 |
|
Labour
|
| Con |
 |
18,596 |
38.50% |
| Lab |
 |
22,574 |
46.80% |
| LD |
 |
6,402 |
13.30% |
| Oth |
 |
688 |
1.40% |
| Maj |
 |
3,978 |
8.20% |
| Turn |
 |
48,260 |
72.73% |
|
|
 |
|

|

