|
Leicestershire North West
Conservative gain

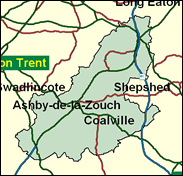
It is hard to remember that this was a Labour gain as recently as 1997, as it now looks so safe. In 1999 for example, the most recent local elections here, in NW Leics district which exactly covers the area of the constituency, Labour (who might have feared suffering an exactly mid-term slump result) beat the Conservatives by nearly 20pc, even more than in 1997, and took 31 of the 40 council places. Although there has been no mining here for some years, the residual left-wing politics of the industry which named the largest town here Coalville is still in evidence. This is also the home seat of Ashby-de-la-Zouch, and thus of Adrian Mole - and so, presumably and if so appropriately, of his New Labour paramour, Pandora Braithwaite.

David Taylor, crumple-faced Labour victor here in 1997, is a local man, born 1946 at Ashby-de-la-Zouch, educated at Ashby Boys’ Grammar School and Leicester Polytechnic, and a former local councillor and computer manager at the nearby Leicestershire County Council offices for 20 years. Claiming to be a traditional mushy-peas rather than an avocado Labourite, he has salted his inconspicuous loyalism with vocal defence of small businesses buried by red tape, and has coped with the threat to his Leicestershire skies from the local East Midlands Airport, by rebelling against air traffic control privatisation. In the dying gasp of the Parliament he sought to curb the threat of passive smoking to the young.
 |
| Wealthy Achievers, Suburban Areas |
18.79% |
14.99% |
125.31 |
|
| Affluent Greys, Rural Communities |
0.63% |
2.13% |
29.64 |
|
| Prosperous Pensioners, Retirement Areas |
0.03% |
2.49% |
1.03 |
|
| Affluent Executives, Family Areas |
4.91% |
4.43% |
110.96 |
|
| Well-Off Workers, Family Areas |
8.37% |
7.27% |
115.02 |
|
| Affluent Urbanites, Town & City Areas |
0.06% |
2.56% |
2.45 |
|
| Prosperous Professionals, Metropolitan Areas |
0.00% |
2.04% |
0.00 |
|
| Better-Off Executives, Inner City Areas |
0.00% |
3.94% |
0.00 |
|
| Comfortable Middle Agers, Mature Home Owning Areas |
16.82% |
13.04% |
129.03 |
|
| Skilled Workers, Home Owning Areas |
25.95% |
12.70% |
204.31 |
|
| New Home Owners, Mature Communities |
12.58% |
8.14% |
154.51 |
|
| White Collar Workers, Better-Off Multi Ethnic Areas |
1.36% |
4.02% |
33.86 |
|
| Older People, Less Prosperous Areas |
2.15% |
3.19% |
67.54 |
|
| Council Estate Residents, Better-Off Homes |
7.01% |
11.31% |
61.94 |
|
| Council Estate Residents, High Unemployment |
0.40% |
3.06% |
13.06 |
|
| Council Estate Residents, Greatest Hardship |
0.94% |
2.52% |
37.26 |
|
| People in Multi-Ethnic, Low-Income Areas |
0.00% |
2.10% |
0.00 |
|
| Unclassified |
0.00% |
0.06% |
0.00 |
|
|
 |
 |
 |
| £0-5K |
8.94% |
9.41% |
95.00 |
|
| £5-10K |
16.58% |
16.63% |
99.70 |
|
| £10-15K |
17.20% |
16.58% |
103.73 |
|
| £15-20K |
14.34% |
13.58% |
105.55 |
|
| £20-25K |
10.95% |
10.39% |
105.39 |
|
| £25-30K |
8.08% |
7.77% |
103.88 |
|
| £30-35K |
5.88% |
5.79% |
101.58 |
|
| £35-40K |
4.28% |
4.33% |
98.89 |
|
| £40-45K |
3.14% |
3.27% |
96.07 |
|
| £45-50K |
2.32% |
2.48% |
93.27 |
|
| £50-55K |
1.73% |
1.90% |
90.60 |
|
| £55-60K |
1.30% |
1.47% |
88.10 |
|
| £60-65K |
0.99% |
1.15% |
85.78 |
|
| £65-70K |
0.76% |
0.91% |
83.65 |
|
| £70-75K |
0.59% |
0.72% |
81.70 |
|
| £75-80K |
0.46% |
0.57% |
79.93 |
|
| £80-85K |
0.36% |
0.46% |
78.32 |
|
| £85-90K |
0.29% |
0.37% |
76.86 |
|
| £90-95K |
0.23% |
0.31% |
75.52 |
|
| £95-100K |
0.19% |
0.25% |
74.31 |
|
| £100K + |
0.93% |
1.34% |
69.07 |
|
|
|

|


|
1992-1997
|
1997-2001
|
|
|
|
| Con |
-14.43% |
| Lab |
12.58% |
| LD |
-1.77% |
|
| Con |
2.96% |
| Lab |
-56.38% |
| LD |
1.70% |
|
|
 |
David Taylor
Conservative gain
|
| Con |
 |
15,274 |
33.94% |
| Lab |
|
0 |
0.00% |
| LD |
 |
4,651 |
10.33% |
| Oth |
 |
25,084 |
55.73% |
| Maj |
 |
10,623 |
23.60% |
| Turn |
 |
45,009 |
65.79% |
|
|
 |
David Taylor
Conservative gain
|
| LD |
Charlie Fraser-Fleming |
4,651 |
10.33% |
| UK |
William Nattrass |
1,021 |
2.27% |
| I |
Robert Nettleton |
632 |
1.40% |
| LC |
David Taylor |
23,431 |
52.06% |
| C |
Nick Weston |
15,274 |
33.94% |
|
Candidates representing 5 parties stood for election to this seat.
|
|
 |
David Taylor
Labour gain
|
| Con |
 |
16,113 |
30.97% |
| Lab |
 |
29,332 |
56.38% |
| LD |
 |
4,492 |
8.63% |
| Ref |
 |
2,088 |
4.01% |
| Oth |
|
0 |
0.00% |
| Maj |
 |
13,219 |
25.41% |
| Turn |
 |
52,025 |
79.95% |
|
|
 |
|
Conservative
|
| Con |
 |
24,735 |
45.40% |
| Lab |
 |
23,869 |
43.80% |
| LD |
 |
5,648 |
10.40% |
| Oth |
 |
198 |
0.40% |
| Maj |
 |
866 |
1.60% |
| Turn |
 |
54,450 |
86.50% |
|
|
 |
|

|

