|
Leigh
Labour hold

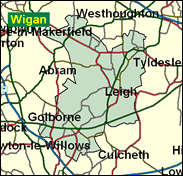
This is a very solid Labour seat on the long closed Lancashire coalfield, which gave Lawrence Cunliffe a majority of over 24,000 in 1997. It has a distinct feel of "the land that time forgot". It is over 99 pc white. It has one of the lowest proportions of one parent households of any of Labour's strongholds in the North west, like its neighbouring seats of Makerfield and Wigan. These are old established Labour heartlands, stable communities, with skilled manual workers heading nuclear families. Let no one say that Labour has lost its core support; they will win next time by a long mile, although the turnout may sink towards 60pc.

Andy Burnham, after a protracted selection process - in which a local councillor was barred and an NEC shortlist imposed, to insert names other than those of local activists - has replaced retiring miner Lawrence Cunliffe in a Labour fortress which has seen only two MPs since 1945. Burnham comes with a clutch of other party staffers inheriting safe seats, as adviser to Culture Secretary Chris Smith and before that, in opposition, to Health spokesmen. Locally-resident until leaving for university, he was born in 1970, educated at St. Aelred's RC High School, Newton-le-Willows and Fitzwilliam College, Cambridge, joined the Labour Party after the 1984 Miners' Strike, and has a long record as an apparatchik as parliamentary lobbyist for NHS unions and as a campaign organiser in the 1997 election in the North West - for which this safe seat is his reward.
 |
| Wealthy Achievers, Suburban Areas |
5.33% |
14.99% |
35.58 |
|
| Affluent Greys, Rural Communities |
0.00% |
2.13% |
0.00 |
|
| Prosperous Pensioners, Retirement Areas |
0.10% |
2.49% |
3.91 |
|
| Affluent Executives, Family Areas |
2.96% |
4.43% |
66.87 |
|
| Well-Off Workers, Family Areas |
18.32% |
7.27% |
251.85 |
|
| Affluent Urbanites, Town & City Areas |
0.03% |
2.56% |
1.28 |
|
| Prosperous Professionals, Metropolitan Areas |
0.00% |
2.04% |
0.00 |
|
| Better-Off Executives, Inner City Areas |
0.00% |
3.94% |
0.00 |
|
| Comfortable Middle Agers, Mature Home Owning Areas |
6.16% |
13.04% |
47.26 |
|
| Skilled Workers, Home Owning Areas |
34.05% |
12.70% |
268.05 |
|
| New Home Owners, Mature Communities |
9.93% |
8.14% |
121.89 |
|
| White Collar Workers, Better-Off Multi Ethnic Areas |
0.00% |
4.02% |
0.00 |
|
| Older People, Less Prosperous Areas |
2.94% |
3.19% |
92.43 |
|
| Council Estate Residents, Better-Off Homes |
16.12% |
11.31% |
142.48 |
|
| Council Estate Residents, High Unemployment |
0.37% |
3.06% |
12.21 |
|
| Council Estate Residents, Greatest Hardship |
3.69% |
2.52% |
146.40 |
|
| People in Multi-Ethnic, Low-Income Areas |
0.00% |
2.10% |
0.00 |
|
| Unclassified |
0.00% |
0.06% |
0.00 |
|
|
 |
 |
 |
| £0-5K |
10.25% |
9.41% |
108.89 |
|
| £5-10K |
19.01% |
16.63% |
114.28 |
|
| £10-15K |
18.59% |
16.58% |
112.11 |
|
| £15-20K |
14.57% |
13.58% |
107.27 |
|
| £20-25K |
10.56% |
10.39% |
101.65 |
|
| £25-30K |
7.47% |
7.77% |
96.04 |
|
| £30-35K |
5.26% |
5.79% |
90.73 |
|
| £35-40K |
3.72% |
4.33% |
85.82 |
|
| £40-45K |
2.65% |
3.27% |
81.31 |
|
| £45-50K |
1.92% |
2.48% |
77.19 |
|
| £50-55K |
1.40% |
1.90% |
73.41 |
|
| £55-60K |
1.03% |
1.47% |
69.95 |
|
| £60-65K |
0.77% |
1.15% |
66.77 |
|
| £65-70K |
0.58% |
0.91% |
63.84 |
|
| £70-75K |
0.44% |
0.72% |
61.13 |
|
| £75-80K |
0.34% |
0.57% |
58.63 |
|
| £80-85K |
0.26% |
0.46% |
56.30 |
|
| £85-90K |
0.20% |
0.37% |
54.14 |
|
| £90-95K |
0.16% |
0.31% |
52.13 |
|
| £95-100K |
0.13% |
0.25% |
50.26 |
|
| £100K + |
0.55% |
1.34% |
40.97 |
|
|
|

|


|
1992-1997
|
1997-2001
|
|
|
|
| Con |
-11.72% |
| Lab |
9.63% |
| LD |
-1.16% |
|
| Con |
2.61% |
| Lab |
-4.38% |
| LD |
1.57% |
|
|
 |
Andrew Burnham
Labour hold
|
| Con |
 |
6,421 |
18.19% |
| Lab |
 |
22,783 |
64.54% |
| LD |
 |
4,524 |
12.82% |
| Oth |
 |
1,570 |
4.45% |
| Maj |
 |
16,362 |
46.35% |
| Turn |
 |
35,298 |
49.68% |
|
|
 |
Andrew Burnham
Labour hold
|
| LD |
Ray Atkins |
4,524 |
12.82% |
| UK |
Chris Best |
750 |
2.12% |
| L |
Andrew Burnham |
22,783 |
64.54% |
| SL |
William Kelly |
820 |
2.32% |
| C |
Andrew Oxley |
6,421 |
18.19% |
|
Candidates representing 5 parties stood for election to this seat.
|
|
 |
Lawrence Cunliffe
Labour
|
| Con |
 |
7,156 |
15.58% |
| Lab |
 |
31,652 |
68.93% |
| LD |
 |
5,163 |
11.24% |
| Ref |
 |
1,949 |
4.24% |
| Oth |
|
0 |
0.00% |
| Maj |
 |
24,496 |
53.34% |
| Turn |
 |
45,920 |
65.69% |
|
|
 |
|
Labour
|
| Con |
 |
14,341 |
27.30% |
| Lab |
 |
31,196 |
59.30% |
| LD |
 |
6,539 |
12.40% |
| Oth |
 |
525 |
1.00% |
| Maj |
 |
16,855 |
32.00% |
| Turn |
 |
52,601 |
74.94% |
|
|
 |
|

|

