|
Leominster
Conservative hold

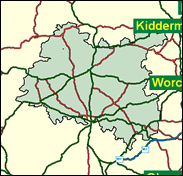
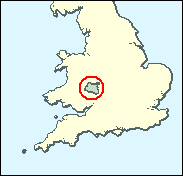
An unlikely Labour seat at present technically, as Peter Temple-Morris, elected as a Tory, defected to the governing party; he is not standing here again, but even if he did, it would make little difference: Leominster, which comprises the northern half of Herefordshire, with its livestock farming including the renowned eponymous breed of cattle, looks fine for the Conservatives' new candidate, Bill Wiggin, who has a solid pedigree - he is the son of the former Weston super Mare member, Jerry Wiggin.

In the steps of floor-crossing Peter Temple-Morris comes another - and maybe this time more loyal - son of a Tory MP, Bill Wiggin, son of Sir Jerry Wiggin (MP for Weston-Super-Mare (1969-1997). Born 1966, and one of the few Old Etonians chosen as new candidates in safe Conservative seats, his educational trajectory after Eton was deviantly to read economics at Bangor rather than Range-Rover crashing at Cirencester. But thereafter he resumed a more conventional path as successively a coffee buyer, a bullion trader, and a merchant banker. Currently with Commerzbank, he is responsible there for foreign exchange option hedging strategy. His assured election - with that of Boris Johnson (Henley), David Cameron (Witney) and Hugo Swire (East Devon) - will help sustain his party’s dwindling rump of Old Etonians.
 |
| Wealthy Achievers, Suburban Areas |
26.58% |
14.99% |
177.30 |
|
| Affluent Greys, Rural Communities |
24.44% |
2.13% |
1,149.38 |
|
| Prosperous Pensioners, Retirement Areas |
5.24% |
2.49% |
210.67 |
|
| Affluent Executives, Family Areas |
1.27% |
4.43% |
28.80 |
|
| Well-Off Workers, Family Areas |
3.17% |
7.27% |
43.63 |
|
| Affluent Urbanites, Town & City Areas |
0.05% |
2.56% |
1.88 |
|
| Prosperous Professionals, Metropolitan Areas |
0.00% |
2.04% |
0.00 |
|
| Better-Off Executives, Inner City Areas |
0.24% |
3.94% |
6.15 |
|
| Comfortable Middle Agers, Mature Home Owning Areas |
16.67% |
13.04% |
127.82 |
|
| Skilled Workers, Home Owning Areas |
6.06% |
12.70% |
47.71 |
|
| New Home Owners, Mature Communities |
7.86% |
8.14% |
96.56 |
|
| White Collar Workers, Better-Off Multi Ethnic Areas |
1.06% |
4.02% |
26.37 |
|
| Older People, Less Prosperous Areas |
3.24% |
3.19% |
101.83 |
|
| Council Estate Residents, Better-Off Homes |
3.77% |
11.31% |
33.34 |
|
| Council Estate Residents, High Unemployment |
0.33% |
3.06% |
10.81 |
|
| Council Estate Residents, Greatest Hardship |
0.00% |
2.52% |
0.00 |
|
| People in Multi-Ethnic, Low-Income Areas |
0.00% |
2.10% |
0.00 |
|
| Unclassified |
0.00% |
0.06% |
7.37 |
|
|
 |
 |
 |
| £0-5K |
9.26% |
9.41% |
98.42 |
|
| £5-10K |
16.59% |
16.63% |
99.71 |
|
| £10-15K |
16.83% |
16.58% |
101.50 |
|
| £15-20K |
13.87% |
13.58% |
102.07 |
|
| £20-25K |
10.57% |
10.39% |
101.74 |
|
| £25-30K |
7.84% |
7.77% |
100.91 |
|
| £30-35K |
5.78% |
5.79% |
99.86 |
|
| £35-40K |
4.28% |
4.33% |
98.77 |
|
| £40-45K |
3.19% |
3.27% |
97.73 |
|
| £45-50K |
2.40% |
2.48% |
96.77 |
|
| £50-55K |
1.83% |
1.90% |
95.91 |
|
| £55-60K |
1.40% |
1.47% |
95.16 |
|
| £60-65K |
1.09% |
1.15% |
94.52 |
|
| £65-70K |
0.85% |
0.91% |
93.98 |
|
| £70-75K |
0.67% |
0.72% |
93.53 |
|
| £75-80K |
0.54% |
0.57% |
93.17 |
|
| £80-85K |
0.43% |
0.46% |
92.87 |
|
| £85-90K |
0.35% |
0.37% |
92.64 |
|
| £90-95K |
0.28% |
0.31% |
92.48 |
|
| £95-100K |
0.23% |
0.25% |
92.36 |
|
| £100K + |
1.25% |
1.34% |
93.21 |
|
|
|

|


|
1992-1997
|
1997-2001
|
|
|
|
| Con |
-11.02% |
| Lab |
5.17% |
| LD |
-0.00% |
|
| Con |
3.88% |
| Lab |
-0.56% |
| LD |
-0.92% |
|
|
 |
Bill Wiggin
Conservative hold
|
| Con |
 |
22,879 |
49.16% |
| Lab |
 |
7,872 |
16.91% |
| LD |
 |
12,512 |
26.88% |
| Oth |
 |
3,280 |
7.05% |
| Maj |
 |
10,367 |
22.27% |
| Turn |
 |
46,543 |
67.75% |
|
|
 |
Bill Wiggin
Conservative hold
|
| G |
Pippa Bennett |
1,690 |
3.63% |
| LD |
Celia Downie |
12,512 |
26.88% |
| L |
Stephen Hart |
7,872 |
16.91% |
| UK |
Christopher Kingsley |
1,590 |
3.42% |
| C |
Bill Wiggin |
22,879 |
49.16% |
|
Candidates representing 5 parties stood for election to this seat.
|
|
 |
Peter Temple-Morris
Conservative
|
| Con |
 |
22,888 |
45.28% |
| Lab |
 |
8,831 |
17.47% |
| LD |
 |
14,053 |
27.80% |
| Ref |
 |
2,815 |
5.57% |
| Oth |
 |
1,966 |
3.89% |
| Maj |
 |
8,835 |
17.48% |
| Turn |
 |
50,553 |
76.60% |
|
|
 |
|
Conservative
|
| Con |
 |
28,837 |
56.30% |
| Lab |
 |
6,294 |
12.30% |
| LD |
 |
14,236 |
27.80% |
| Oth |
 |
1,811 |
3.50% |
| Maj |
 |
14,601 |
28.50% |
| Turn |
 |
51,178 |
81.00% |
|
|
 |
|

|

