|
Lewes
Liberal Democrat hold

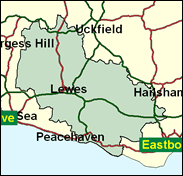
If activity were a guarantee of continuance in the Commons, Lewes Liberal Democrat Norman Baker would have one of the safest seats in the House. In a constituency in the heart of East Sussex, with a mixture of county town, lush countryside, and seaside communities with a high proportion of elderly residents, with a much longer tradition of Conservatism, however, this very much remains to be seen. Little in the way of local or Euro-election evidence can help us to predict: the former is usually skewed towards the Liberal Democrats, the latter towards the Tories, and that is exactly the basis of the conflicting messages of May and June 1999 in Lewes. This probably would be one of the constituencies which would fall if the Liberal Democrats lose 10 or 15 seats to the Conservatives, as a uniform application of national or regional swings in the spring of 2001 suggests. However, as in several, indeed most, of the other vulnerable LD seats, the MP's activism gives them hope that they will do better where they have incumbents. He is merely the most 'hyper' of such activists. In the first week of the election campaign, Lewes was featured as Labour activists risked expulsion by publicly advocating tactical voting in Baker's interest. Yet few noticed that the Labour vote in Lewes is already smaller than that in any other vulnerable Liberal Democrat seats except for Winchester and Romsey, both distorted by by-elections since 1997.

Norman Baker, the first Liberal (Democrat) MP in Sussex since the 1920s, won here in 1997 and quickly established a reputation as a blunderbuss-style targeter of corruption and malpractice. Of somewhat reptilian visage, with a cynical glint in his eye, and a populist political animal to his fingertips, he rose locally as a councillor and bag-carrier for the Lib Dem MP-for-Eastbourne-for-2-years, David Belotti. Residually Scots-accented, he was born in Aberdeen in 1957 and educated at Royal Liberty School, Romford and at Royal Holloway College, London and worked disparately as a language teacher, railway station manager, off-licence and record chain shop manager. Predictably loathed by local Tories for his constituency-wide ubiquity and high press profile, they might dislike him less following his role in Peter Mandelson’s assassination as tabler of the question that exposed the Minister’s alleged involvement in the Hinduja brothers’ passport bid. But to rid Lewes of Baker, the Tories have gone local, selecting chubby-faced Brighton-based barrister Simon Sinnatt, who was born 1969, educated at Lewes Priory School and at York and then the local Sussex University, and a local county councillor (for Chailey) since 1997. He resisted the Telegraph’s listing of him as a ‘Europhile’.
 |
| Wealthy Achievers, Suburban Areas |
25.81% |
14.99% |
172.17 |
|
| Affluent Greys, Rural Communities |
1.01% |
2.13% |
47.30 |
|
| Prosperous Pensioners, Retirement Areas |
20.08% |
2.49% |
807.77 |
|
| Affluent Executives, Family Areas |
0.97% |
4.43% |
21.97 |
|
| Well-Off Workers, Family Areas |
4.01% |
7.27% |
55.12 |
|
| Affluent Urbanites, Town & City Areas |
2.57% |
2.56% |
100.27 |
|
| Prosperous Professionals, Metropolitan Areas |
2.93% |
2.04% |
143.67 |
|
| Better-Off Executives, Inner City Areas |
0.54% |
3.94% |
13.60 |
|
| Comfortable Middle Agers, Mature Home Owning Areas |
18.35% |
13.04% |
140.73 |
|
| Skilled Workers, Home Owning Areas |
5.73% |
12.70% |
45.13 |
|
| New Home Owners, Mature Communities |
8.12% |
8.14% |
99.70 |
|
| White Collar Workers, Better-Off Multi Ethnic Areas |
2.47% |
4.02% |
61.53 |
|
| Older People, Less Prosperous Areas |
1.85% |
3.19% |
58.06 |
|
| Council Estate Residents, Better-Off Homes |
5.52% |
11.31% |
48.78 |
|
| Council Estate Residents, High Unemployment |
0.03% |
3.06% |
1.06 |
|
| Council Estate Residents, Greatest Hardship |
0.00% |
2.52% |
0.00 |
|
| People in Multi-Ethnic, Low-Income Areas |
0.00% |
2.10% |
0.00 |
|
| Unclassified |
0.00% |
0.06% |
0.00 |
|
|
 |
 |
 |
| £0-5K |
8.70% |
9.41% |
92.42 |
|
| £5-10K |
15.66% |
16.63% |
94.17 |
|
| £10-15K |
16.14% |
16.58% |
97.34 |
|
| £15-20K |
13.58% |
13.58% |
99.96 |
|
| £20-25K |
10.59% |
10.39% |
101.93 |
|
| £25-30K |
8.04% |
7.77% |
103.40 |
|
| £30-35K |
6.05% |
5.79% |
104.53 |
|
| £35-40K |
4.57% |
4.33% |
105.42 |
|
| £40-45K |
3.47% |
3.27% |
106.15 |
|
| £45-50K |
2.65% |
2.48% |
106.78 |
|
| £50-55K |
2.04% |
1.90% |
107.33 |
|
| £55-60K |
1.59% |
1.47% |
107.81 |
|
| £60-65K |
1.25% |
1.15% |
108.26 |
|
| £65-70K |
0.98% |
0.91% |
108.66 |
|
| £70-75K |
0.78% |
0.72% |
109.04 |
|
| £75-80K |
0.63% |
0.57% |
109.39 |
|
| £80-85K |
0.51% |
0.46% |
109.72 |
|
| £85-90K |
0.41% |
0.37% |
110.02 |
|
| £90-95K |
0.34% |
0.31% |
110.31 |
|
| £95-100K |
0.28% |
0.25% |
110.58 |
|
| £100K + |
1.50% |
1.34% |
111.76 |
|
|
|

|


|
1992-1997
|
1997-2001
|
|
|
|
| Con |
-10.73% |
| Lab |
2.44% |
| LD |
4.12% |
|
| Con |
-5.63% |
| Lab |
-3.34% |
| LD |
13.10% |
|
|
 |
Norman Baker
Liberal Democrat hold
|
| Con |
 |
15,878 |
34.95% |
| Lab |
 |
3,317 |
7.30% |
| LD |
 |
25,588 |
56.32% |
| Oth |
 |
650 |
1.43% |
| Maj |
 |
9,710 |
21.37% |
| Turn |
 |
45,433 |
68.49% |
|
|
 |
Norman Baker
Liberal Democrat hold
|
| LD |
Norman Baker |
25,588 |
56.32% |
| UK |
John Harvey |
650 |
1.43% |
| L |
Paul Richards |
3,317 |
7.30% |
| C |
Simon Sinnatt |
15,878 |
34.95% |
|
Candidates representing 4 parties stood for election to this seat.
|
|
 |
Norman Baker
Liberal Democrat gain
|
| Con |
 |
19,950 |
40.57% |
| Lab |
 |
5,232 |
10.64% |
| LD |
 |
21,250 |
43.22% |
| Ref |
 |
2,481 |
5.05% |
| Oth |
 |
256 |
0.52% |
| Maj |
 |
1,300 |
2.64% |
| Turn |
 |
49,169 |
76.42% |
|
|
 |
|
Conservative
|
| Con |
 |
26,638 |
51.30% |
| Lab |
 |
4,270 |
8.20% |
| LD |
 |
20,301 |
39.10% |
| Oth |
 |
677 |
1.30% |
| Maj |
 |
6,337 |
12.20% |
| Turn |
 |
51,886 |
81.82% |
|
|
 |
|

|

