|
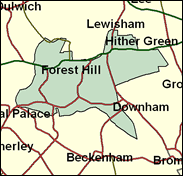
Lewisham West
Labour hold

As with Lewisham East, this part of Middle London in the south eastern quadrant of the capital has now been transformed from a marginal, held by a Tory until 1992, to a safe Labour seat, without a single Conservative councillor, even in Catford, which was once known as the epitome of unpretentious respectability.

Jim Dowd, elected in 1992 and a Whip since 1993, with an interlude as a Northern Ireland spokesman in Opposition, though London-raised comes from a half-Irish, half-German background. Born in Germany in 1951, he was employed as a telecommunications engineer for 15 years while doubling-up for 20 years as a Lewisham councillor, where he learnt the habits of discipline now expected of Labour’s large parliamentary majority, by someone who has spent only one of his nine years as MP off the front bench.
 |
| Wealthy Achievers, Suburban Areas |
1.75% |
14.99% |
11.70 |
|
| Affluent Greys, Rural Communities |
0.00% |
2.13% |
0.00 |
|
| Prosperous Pensioners, Retirement Areas |
0.40% |
2.49% |
16.11 |
|
| Affluent Executives, Family Areas |
0.00% |
4.43% |
0.00 |
|
| Well-Off Workers, Family Areas |
0.05% |
7.27% |
0.72 |
|
| Affluent Urbanites, Town & City Areas |
1.47% |
2.56% |
57.22 |
|
| Prosperous Professionals, Metropolitan Areas |
20.15% |
2.04% |
987.03 |
|
| Better-Off Executives, Inner City Areas |
10.75% |
3.94% |
272.55 |
|
| Comfortable Middle Agers, Mature Home Owning Areas |
2.57% |
13.04% |
19.69 |
|
| Skilled Workers, Home Owning Areas |
1.05% |
12.70% |
8.30 |
|
| New Home Owners, Mature Communities |
0.00% |
8.14% |
0.00 |
|
| White Collar Workers, Better-Off Multi Ethnic Areas |
38.02% |
4.02% |
945.34 |
|
| Older People, Less Prosperous Areas |
0.46% |
3.19% |
14.48 |
|
| Council Estate Residents, Better-Off Homes |
6.65% |
11.31% |
58.75 |
|
| Council Estate Residents, High Unemployment |
12.26% |
3.06% |
400.24 |
|
| Council Estate Residents, Greatest Hardship |
0.00% |
2.52% |
0.00 |
|
| People in Multi-Ethnic, Low-Income Areas |
4.43% |
2.10% |
210.90 |
|
| Unclassified |
0.00% |
0.06% |
0.00 |
|
|
 |
 |
 |
| £0-5K |
7.75% |
9.41% |
82.36 |
|
| £5-10K |
13.50% |
16.63% |
81.19 |
|
| £10-15K |
14.39% |
16.58% |
86.82 |
|
| £15-20K |
12.74% |
13.58% |
93.81 |
|
| £20-25K |
10.48% |
10.39% |
100.83 |
|
| £25-30K |
8.35% |
7.77% |
107.44 |
|
| £30-35K |
6.58% |
5.79% |
113.52 |
|
| £35-40K |
5.16% |
4.33% |
119.04 |
|
| £40-45K |
4.05% |
3.27% |
124.05 |
|
| £45-50K |
3.19% |
2.48% |
128.59 |
|
| £50-55K |
2.53% |
1.90% |
132.72 |
|
| £55-60K |
2.01% |
1.47% |
136.50 |
|
| £60-65K |
1.61% |
1.15% |
139.95 |
|
| £65-70K |
1.30% |
0.91% |
143.14 |
|
| £70-75K |
1.05% |
0.72% |
146.08 |
|
| £75-80K |
0.86% |
0.57% |
148.82 |
|
| £80-85K |
0.70% |
0.46% |
151.37 |
|
| £85-90K |
0.58% |
0.37% |
153.75 |
|
| £90-95K |
0.48% |
0.31% |
156.00 |
|
| £95-100K |
0.40% |
0.25% |
158.12 |
|
| £100K + |
2.28% |
1.34% |
169.73 |
|
|
|

|


|
1992-1997
|
1997-2001
|
|
|
|
| Con |
-19.00% |
| Lab |
14.99% |
| LD |
-0.12% |
|
| Con |
-1.42% |
| Lab |
-0.93% |
| LD |
3.67% |
|
|
 |
Jim Dowd
Labour hold
|
| Con |
 |
6,896 |
22.38% |
| Lab |
 |
18,816 |
61.06% |
| LD |
 |
4,146 |
13.45% |
| Oth |
 |
957 |
3.11% |
| Maj |
 |
11,920 |
38.68% |
| Turn |
 |
30,815 |
50.56% |
|
|
 |
Jim Dowd
Labour hold
|
| L |
Jim Dowd |
18,816 |
61.06% |
| C |
Gary Johnson |
6,896 |
22.38% |
| I |
Nick Long |
472 |
1.53% |
| UK |
Frederick Pearson |
485 |
1.57% |
| LD |
Richard Thomas |
4,146 |
13.45% |
|
Candidates representing 5 parties stood for election to this seat.
|
|
 |
Jim Dowd
Labour
|
| Con |
 |
8,936 |
23.80% |
| Lab |
 |
23,273 |
61.99% |
| LD |
 |
3,672 |
9.78% |
| Ref |
 |
1,098 |
2.92% |
| Oth |
 |
565 |
1.50% |
| Maj |
 |
14,337 |
38.19% |
| Turn |
 |
37,544 |
64.00% |
|
|
 |
|
Labour
|
| Con |
 |
18,569 |
42.80% |
| Lab |
 |
20,378 |
47.00% |
| LD |
 |
4,295 |
9.90% |
| Oth |
 |
125 |
0.30% |
| Maj |
 |
1,809 |
4.20% |
| Turn |
 |
43,367 |
72.12% |
|
|
 |
|

|

