|
Leyton & Wanstead
Labour hold

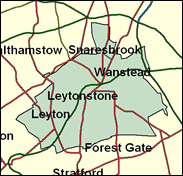
Wanstead and Woodford was until 1997 always Conservative; indeed this was the successor to Winston Churchill's last constituency, Woodford, which he held until his retirement at the age of 90 as Father of the House of Commons in 1964, just a few months before his death. However, the Wanstead part, noted for its rather scrubby open land known as the Flats was always less Tory than Woodford further out, and both its Redbridge Borough wards, Snaresbrook and Wanstead, were won by Labour in May 1998 as the government's unusually passionate and warm honeymoon continued. Meanwhile the majority of the seat is in Waltham Forest Borough. Leyton has a different electoral history. Certainly it famously rejected Labour once, when a rather crude attempt was made to smuggle Patrick Gordon Walker into the Commons in a by-election contrived in 1965 after the Foreign Secretary designate was beaten in a racist campaign in Smethwick; but since 1966 it has always been safe, as will be this new combined cross-border division.

Harry Cohen, elected here in 1983 in the wake of Bryan Magee’s defection to the SDP, is a de-bearded, toned-down version of his formerly high-decibelled, but still Cockney-accented self, and lacking - it has been suggested - the sourness of his hard left colleagues. A pro-Palestinian Jew who opposed the Gulf War and criticises Israel, he rebelled 36 times against the Whips in the 1992-97 Parliament. Born 1949, son of a cab driver, he attended secondary modern schools and East Ham Technical College, before training as an accountant. A short and chirpy Cockney sparrow with the style of a market trader, despite his retained Campaign Group membership, his rebellions against the Blair government have been modest: on freedom of information, military action against Iraq, and curbs on jury trials, with his settling instead for specialist scrutiny on the Defence Select Committee. The hard left Socialist Alliance has threatened to run against him over his non-rebellious record.
 |
| Wealthy Achievers, Suburban Areas |
2.88% |
14.99% |
19.18 |
|
| Affluent Greys, Rural Communities |
0.00% |
2.13% |
0.00 |
|
| Prosperous Pensioners, Retirement Areas |
3.01% |
2.49% |
120.97 |
|
| Affluent Executives, Family Areas |
0.00% |
4.43% |
0.00 |
|
| Well-Off Workers, Family Areas |
0.00% |
7.27% |
0.00 |
|
| Affluent Urbanites, Town & City Areas |
8.69% |
2.56% |
338.83 |
|
| Prosperous Professionals, Metropolitan Areas |
18.47% |
2.04% |
904.70 |
|
| Better-Off Executives, Inner City Areas |
8.58% |
3.94% |
217.54 |
|
| Comfortable Middle Agers, Mature Home Owning Areas |
1.00% |
13.04% |
7.71 |
|
| Skilled Workers, Home Owning Areas |
0.00% |
12.70% |
0.00 |
|
| New Home Owners, Mature Communities |
0.00% |
8.14% |
0.00 |
|
| White Collar Workers, Better-Off Multi Ethnic Areas |
41.63% |
4.02% |
1,035.12 |
|
| Older People, Less Prosperous Areas |
0.00% |
3.19% |
0.00 |
|
| Council Estate Residents, Better-Off Homes |
0.51% |
11.31% |
4.52 |
|
| Council Estate Residents, High Unemployment |
4.48% |
3.06% |
146.28 |
|
| Council Estate Residents, Greatest Hardship |
0.00% |
2.52% |
0.00 |
|
| People in Multi-Ethnic, Low-Income Areas |
10.75% |
2.10% |
511.72 |
|
| Unclassified |
0.01% |
0.06% |
18.68 |
|
|
 |
 |
 |
| £0-5K |
6.99% |
9.41% |
74.26 |
|
| £5-10K |
12.86% |
16.63% |
77.34 |
|
| £10-15K |
14.14% |
16.58% |
85.31 |
|
| £15-20K |
12.78% |
13.58% |
94.06 |
|
| £20-25K |
10.65% |
10.39% |
102.50 |
|
| £25-30K |
8.57% |
7.77% |
110.27 |
|
| £30-35K |
6.79% |
5.79% |
117.27 |
|
| £35-40K |
5.35% |
4.33% |
123.50 |
|
| £40-45K |
4.21% |
3.27% |
129.03 |
|
| £45-50K |
3.32% |
2.48% |
133.91 |
|
| £50-55K |
2.63% |
1.90% |
138.23 |
|
| £55-60K |
2.09% |
1.47% |
142.04 |
|
| £60-65K |
1.67% |
1.15% |
145.41 |
|
| £65-70K |
1.34% |
0.91% |
148.38 |
|
| £70-75K |
1.09% |
0.72% |
151.01 |
|
| £75-80K |
0.88% |
0.57% |
153.33 |
|
| £80-85K |
0.72% |
0.46% |
155.39 |
|
| £85-90K |
0.59% |
0.37% |
157.21 |
|
| £90-95K |
0.48% |
0.31% |
158.81 |
|
| £95-100K |
0.40% |
0.25% |
160.22 |
|
| £100K + |
2.21% |
1.34% |
164.54 |
|
|
|

|


|
1992-1997
|
1997-2001
|
|
|
|
| Con |
-8.68% |
| Lab |
15.04% |
| LD |
-5.44% |
|
| Con |
-2.48% |
| Lab |
-2.83% |
| LD |
0.93% |
|
|
 |
Harry Cohen
Labour hold
|
| Con |
 |
6,654 |
19.73% |
| Lab |
 |
19,558 |
58.00% |
| LD |
 |
5,389 |
15.98% |
| Oth |
 |
2,117 |
6.28% |
| Maj |
 |
12,904 |
38.27% |
| Turn |
 |
33,718 |
54.78% |
|
|
 |
Harry Cohen
Labour hold
|
| L |
Harry Cohen |
19,558 |
58.00% |
| UK |
Michael D'Ingerthorp |
378 |
1.12% |
| G |
Ashley Gunstock |
1,030 |
3.05% |
| C |
Edward Heckels |
6,654 |
19.73% |
| SA |
Sally Labern |
709 |
2.10% |
| LD |
Alex Wilcock |
5,389 |
15.98% |
|
Candidates representing 6 parties stood for election to this seat.
|
|
 |
Harry Cohen
Labour
|
| Con |
 |
8,736 |
22.22% |
| Lab |
 |
23,922 |
60.84% |
| LD |
 |
5,920 |
15.06% |
| Ref |
|
0 |
0.00% |
| Oth |
 |
744 |
1.89% |
| Maj |
 |
15,186 |
38.62% |
| Turn |
 |
39,322 |
63.24% |
|
|
 |
|
Labour
|
| Con |
 |
14,006 |
30.90% |
| Lab |
 |
20,775 |
45.80% |
| LD |
 |
9,300 |
20.50% |
| Oth |
 |
1,275 |
2.80% |
| Maj |
 |
6,769 |
14.90% |
| Turn |
 |
45,356 |
68.92% |
|
|
 |
|

|

