|
Lichfield
Conservative hold

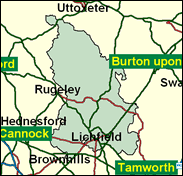
If Labour's overall majority reaches 200 next time, we may have seen the last of the colourful Tory MP for Lichfield in mid-Staffordshire, Michael Fabricant, who only held on against the mighty surge by 238 votes in 1997. However, in any other circumstances, even the fact that Lichfield's cathedral is named after St Chad is unlikely, in the aftermath of the re-re-counted Florida elections in the USA, to prove a harbinger of another super-close result. In any case, any competitive result is unlikely to include the Liberal Democrat candidate, who is reported to be scheduled to be out of the country on business on election day.

Michael Fabricant, elected in 1992 for an earlier version of this seat, is the son of a Brighton rabbi. He was born in 1950 and educated at Brighton & Hove Grammar School and at four universities, including Sussex and Southern California. A fluent, red-faced, oleaginous former electronics engineer who was once (according to Simon Hoggart) “well-known as a disk jockey in several parts of Hove”, he is famous essentially for his syrup-like “barnet”. An orthodox Eurosceptic, but with a light-weight persona as a self-parodying Commons performer, he is among the Tory minority who vote for homosexual sex at 16. The Labour challenger this time is a new parliamentary candidate, Martin Machray, a PR man who was a nurse. Educated at Greencroft Secondary School, the Open University and Aston University, he sits on Lichfield Council for the Fazeley ward.
 |
| Wealthy Achievers, Suburban Areas |
28.02% |
14.99% |
186.87 |
|
| Affluent Greys, Rural Communities |
0.57% |
2.13% |
26.69 |
|
| Prosperous Pensioners, Retirement Areas |
1.44% |
2.49% |
57.92 |
|
| Affluent Executives, Family Areas |
11.30% |
4.43% |
255.38 |
|
| Well-Off Workers, Family Areas |
17.29% |
7.27% |
237.68 |
|
| Affluent Urbanites, Town & City Areas |
0.96% |
2.56% |
37.51 |
|
| Prosperous Professionals, Metropolitan Areas |
0.26% |
2.04% |
12.73 |
|
| Better-Off Executives, Inner City Areas |
0.00% |
3.94% |
0.00 |
|
| Comfortable Middle Agers, Mature Home Owning Areas |
12.64% |
13.04% |
96.95 |
|
| Skilled Workers, Home Owning Areas |
8.81% |
12.70% |
69.38 |
|
| New Home Owners, Mature Communities |
10.17% |
8.14% |
124.92 |
|
| White Collar Workers, Better-Off Multi Ethnic Areas |
0.02% |
4.02% |
0.61 |
|
| Older People, Less Prosperous Areas |
1.79% |
3.19% |
56.17 |
|
| Council Estate Residents, Better-Off Homes |
6.21% |
11.31% |
54.88 |
|
| Council Estate Residents, High Unemployment |
0.09% |
3.06% |
2.80 |
|
| Council Estate Residents, Greatest Hardship |
0.26% |
2.52% |
10.17 |
|
| People in Multi-Ethnic, Low-Income Areas |
0.00% |
2.10% |
0.00 |
|
| Unclassified |
0.17% |
0.06% |
277.19 |
|
|
 |
 |
 |
| £0-5K |
6.92% |
9.41% |
73.47 |
|
| £5-10K |
13.62% |
16.63% |
81.88 |
|
| £10-15K |
15.17% |
16.58% |
91.48 |
|
| £15-20K |
13.58% |
13.58% |
99.94 |
|
| £20-25K |
11.09% |
10.39% |
106.73 |
|
| £25-30K |
8.70% |
7.77% |
111.93 |
|
| £30-35K |
6.71% |
5.79% |
115.79 |
|
| £35-40K |
5.14% |
4.33% |
118.58 |
|
| £40-45K |
3.94% |
3.27% |
120.54 |
|
| £45-50K |
3.02% |
2.48% |
121.87 |
|
| £50-55K |
2.34% |
1.90% |
122.71 |
|
| £55-60K |
1.82% |
1.47% |
123.19 |
|
| £60-65K |
1.42% |
1.15% |
123.39 |
|
| £65-70K |
1.12% |
0.91% |
123.39 |
|
| £70-75K |
0.89% |
0.72% |
123.23 |
|
| £75-80K |
0.71% |
0.57% |
122.95 |
|
| £80-85K |
0.57% |
0.46% |
122.59 |
|
| £85-90K |
0.46% |
0.37% |
122.16 |
|
| £90-95K |
0.37% |
0.31% |
121.68 |
|
| £95-100K |
0.30% |
0.25% |
121.16 |
|
| £100K + |
1.57% |
1.34% |
117.06 |
|
|
|

|


|
1992-1997
|
1997-2001
|
|
|
|
| Con |
-14.09% |
| Lab |
5.82% |
| LD |
5.56% |
|
| Con |
6.22% |
| Lab |
-3.91% |
| LD |
-0.56% |
|
|
 |
Michael Fabricant
Conservative hold
|
| Con |
 |
20,480 |
49.14% |
| Lab |
 |
16,054 |
38.52% |
| LD |
 |
4,462 |
10.71% |
| Oth |
 |
684 |
1.64% |
| Maj |
 |
4,426 |
10.62% |
| Turn |
 |
41,680 |
65.34% |
|
|
 |
Michael Fabricant
Conservative hold
|
| LD |
Phillip Bennion |
4,462 |
10.71% |
| C |
Michael Fabricant |
20,480 |
49.14% |
| L |
Martin Machray |
16,054 |
38.52% |
| UK |
John Phazey |
684 |
1.64% |
|
Candidates representing 4 parties stood for election to this seat.
|
|
 |
Michael Fabricant
Conservative
|
| Con |
 |
20,853 |
42.91% |
| Lab |
 |
20,615 |
42.42% |
| LD |
 |
5,473 |
11.26% |
| Ref |
 |
1,652 |
3.40% |
| Oth |
|
0 |
0.00% |
| Maj |
 |
238 |
0.49% |
| Turn |
 |
48,593 |
77.48% |
|
|
 |
|
Conservative
|
| Con |
 |
29,583 |
57.00% |
| Lab |
 |
18,993 |
36.60% |
| LD |
 |
2,970 |
5.70% |
| Oth |
 |
312 |
0.60% |
| Maj |
 |
10,590 |
20.40% |
| Turn |
 |
51,858 |
83.65% |
|
|
 |
|

|

