|
Lincoln
Labour hold

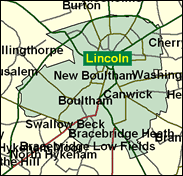
The results in the City of Lincoln, once one of the most typical and key marginals in the whole of England, were somewhat closer in the May 2000 local elections than for some years - the Tories actually won in four wards - but Labour retain a very strong position and every prospect of re-election for Gillian Merron. The Centre parties hold Lincoln dear as an early precursor of Social Democracy through the career of Dick Taverne, who resigned from his leftwards sliding party and triumphed in a by-election in 1973, then even more creditably held on in February 1974 in a full General Election, opposed by the main established parties. Now, however the centre challenge is weaker than average in Lincoln; the Taverne House Social Club for his Democratic Labour party eventually closed and was reopened as a night-club called the Rack and Ruin.

Gillian Merron, Labour’s quiet victor here in 1997, comes from a background as a Union (UNISON) organiser. She was picked from an all-women shortlist, and as a loyalist was made a PPS in 1998, by 1999 to the Defence Minister, Baroness Symonds. Born 1959 and educated at Wanstead High School and Lancaster University, the pursuer of modishly apolitical issues relating to Commons’ working hours and football, she generally focuses on constituency concerns such as the near bottom-ranked local university, and is elusive about details concerning her family.
 |
| Wealthy Achievers, Suburban Areas |
4.83% |
14.99% |
32.19 |
|
| Affluent Greys, Rural Communities |
0.00% |
2.13% |
0.00 |
|
| Prosperous Pensioners, Retirement Areas |
1.80% |
2.49% |
72.59 |
|
| Affluent Executives, Family Areas |
2.53% |
4.43% |
57.09 |
|
| Well-Off Workers, Family Areas |
10.11% |
7.27% |
139.05 |
|
| Affluent Urbanites, Town & City Areas |
0.39% |
2.56% |
15.18 |
|
| Prosperous Professionals, Metropolitan Areas |
0.00% |
2.04% |
0.00 |
|
| Better-Off Executives, Inner City Areas |
2.83% |
3.94% |
71.69 |
|
| Comfortable Middle Agers, Mature Home Owning Areas |
13.62% |
13.04% |
104.44 |
|
| Skilled Workers, Home Owning Areas |
17.25% |
12.70% |
135.82 |
|
| New Home Owners, Mature Communities |
10.62% |
8.14% |
130.41 |
|
| White Collar Workers, Better-Off Multi Ethnic Areas |
8.12% |
4.02% |
202.00 |
|
| Older People, Less Prosperous Areas |
9.81% |
3.19% |
308.10 |
|
| Council Estate Residents, Better-Off Homes |
9.72% |
11.31% |
85.96 |
|
| Council Estate Residents, High Unemployment |
1.94% |
3.06% |
63.32 |
|
| Council Estate Residents, Greatest Hardship |
6.42% |
2.52% |
254.97 |
|
| People in Multi-Ethnic, Low-Income Areas |
0.00% |
2.10% |
0.00 |
|
| Unclassified |
0.00% |
0.06% |
0.00 |
|
|
 |
 |
 |
| £0-5K |
13.67% |
9.41% |
145.22 |
|
| £5-10K |
23.14% |
16.63% |
139.12 |
|
| £10-15K |
20.31% |
16.58% |
122.49 |
|
| £15-20K |
14.35% |
13.58% |
105.65 |
|
| £20-25K |
9.45% |
10.39% |
90.97 |
|
| £25-30K |
6.12% |
7.77% |
78.69 |
|
| £30-35K |
3.97% |
5.79% |
68.54 |
|
| £35-40K |
2.61% |
4.33% |
60.17 |
|
| £40-45K |
1.74% |
3.27% |
53.24 |
|
| £45-50K |
1.18% |
2.48% |
47.47 |
|
| £50-55K |
0.81% |
1.90% |
42.62 |
|
| £55-60K |
0.57% |
1.47% |
38.52 |
|
| £60-65K |
0.40% |
1.15% |
35.04 |
|
| £65-70K |
0.29% |
0.91% |
32.05 |
|
| £70-75K |
0.21% |
0.72% |
29.48 |
|
| £75-80K |
0.16% |
0.57% |
27.24 |
|
| £80-85K |
0.12% |
0.46% |
25.29 |
|
| £85-90K |
0.09% |
0.37% |
23.57 |
|
| £90-95K |
0.07% |
0.31% |
22.05 |
|
| £95-100K |
0.05% |
0.25% |
20.70 |
|
| £100K + |
0.20% |
1.34% |
15.21 |
|
|
|

|


|
1992-1997
|
1997-2001
|
|
|
|
| Con |
-13.19% |
| Lab |
8.92% |
| LD |
2.04% |
|
| Con |
0.19% |
| Lab |
-1.04% |
| LD |
1.82% |
|
|
 |
Gillian Merron
Labour hold
|
| Con |
 |
11,583 |
31.20% |
| Lab |
 |
20,003 |
53.88% |
| LD |
 |
4,703 |
12.67% |
| Oth |
 |
836 |
2.25% |
| Maj |
 |
8,420 |
22.68% |
| Turn |
 |
37,125 |
56.00% |
|
|
 |
Gillian Merron
Labour hold
|
| UK |
Roger Doughty |
836 |
2.25% |
| LD |
Lisa Gabriel |
4,703 |
12.67% |
| L |
Gillian Merron |
20,003 |
53.88% |
| C |
Christine Talbot |
11,583 |
31.20% |
|
Candidates representing 4 parties stood for election to this seat.
|
|
 |
Gillian Merron
Labour
|
| Con |
 |
14,433 |
31.01% |
| Lab |
 |
25,563 |
54.92% |
| LD |
 |
5,048 |
10.84% |
| Ref |
 |
1,329 |
2.86% |
| Oth |
 |
175 |
0.38% |
| Maj |
 |
11,130 |
23.91% |
| Turn |
 |
46,548 |
71.08% |
|
|
 |
|
Labour
|
| Con |
 |
22,905 |
44.20% |
| Lab |
 |
23,869 |
46.00% |
| LD |
 |
4,561 |
8.80% |
| Oth |
 |
500 |
1.00% |
| Maj |
 |
964 |
1.90% |
| Turn |
 |
51,835 |
79.64% |
|
|
 |
|

|

