|
Linlithgow
Labour hold

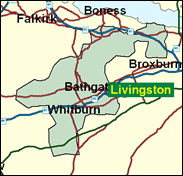
Despite a history of SNP activity, largely stimulated by its long-standing MP's unionist scepticism, Linlithgow, the historic heart of West Lothian, will almost certainly remain safe for the eccentric and individual member since 1962, Tam Dalyell, who would therefore become the new Father of the House of Commons in succession to Sir Edward Heath. Just before Easter in April 2001 news broke of a threatened loss of 3,000 jobs at the American-owned Motorola mobile phone manufacturing plant at Bathgate, one of the gaggle of small working class towns set among the coal slag heaps (or in local parlance pit bings) which are far more typical of this constituency than its MP's stately pile, The Binns.

Tam Dalyell (not aka Sir Tam Dalyell, tenth baronet, of the Binns, Linlithgow) was first elected in 1962, and so (if re-elected) becomes Father of the House, on the retirement of Sir Edward Heath. A ponderously-articulated eccentric who perceptively admits that to be effective you don’t have to mind being a bore, he is known for his dogged campaigns, all worthy of display on his regimental standard: Belgrano, Lockerbie, Westland, the Gulf War, and the West Lothian Question - which beats Schleswig-Holstein as the one nobody bothers answering. He has rebelled against the Blair government on students' fees, incapacity benefits, legal aid cuts, freedom of information and air traffic control privatisation. Born 1932, the grandson and great-grandson of Bengal governors, he is one of Labour’s two Old Etonians, followed in both cases by Trinity, Cambridge, wears ankle length trousers and walks with a shuffling gait.
 |
| Wealthy Achievers, Suburban Areas |
5.04% |
14.99% |
33.61 |
|
| Affluent Greys, Rural Communities |
0.33% |
2.13% |
15.61 |
|
| Prosperous Pensioners, Retirement Areas |
0.27% |
2.49% |
10.85 |
|
| Affluent Executives, Family Areas |
8.78% |
4.43% |
198.36 |
|
| Well-Off Workers, Family Areas |
9.91% |
7.27% |
136.31 |
|
| Affluent Urbanites, Town & City Areas |
2.13% |
2.56% |
83.06 |
|
| Prosperous Professionals, Metropolitan Areas |
0.50% |
2.04% |
24.29 |
|
| Better-Off Executives, Inner City Areas |
0.10% |
3.94% |
2.44 |
|
| Comfortable Middle Agers, Mature Home Owning Areas |
2.38% |
13.04% |
18.24 |
|
| Skilled Workers, Home Owning Areas |
7.21% |
12.70% |
56.72 |
|
| New Home Owners, Mature Communities |
14.62% |
8.14% |
179.54 |
|
| White Collar Workers, Better-Off Multi Ethnic Areas |
0.04% |
4.02% |
1.05 |
|
| Older People, Less Prosperous Areas |
4.47% |
3.19% |
140.31 |
|
| Council Estate Residents, Better-Off Homes |
34.53% |
11.31% |
305.31 |
|
| Council Estate Residents, High Unemployment |
6.94% |
3.06% |
226.64 |
|
| Council Estate Residents, Greatest Hardship |
2.76% |
2.52% |
109.43 |
|
| People in Multi-Ethnic, Low-Income Areas |
0.00% |
2.10% |
0.00 |
|
| Unclassified |
0.00% |
0.06% |
0.00 |
|
|
 |
 |
 |
| £0-5K |
10.21% |
9.41% |
108.51 |
|
| £5-10K |
17.64% |
16.63% |
106.04 |
|
| £10-15K |
17.23% |
16.58% |
103.90 |
|
| £15-20K |
13.83% |
13.58% |
101.80 |
|
| £20-25K |
10.38% |
10.39% |
99.88 |
|
| £25-30K |
7.63% |
7.77% |
98.16 |
|
| £30-35K |
5.59% |
5.79% |
96.58 |
|
| £35-40K |
4.12% |
4.33% |
95.10 |
|
| £40-45K |
3.06% |
3.27% |
93.63 |
|
| £45-50K |
2.29% |
2.48% |
92.16 |
|
| £50-55K |
1.73% |
1.90% |
90.66 |
|
| £55-60K |
1.31% |
1.47% |
89.12 |
|
| £60-65K |
1.01% |
1.15% |
87.54 |
|
| £65-70K |
0.78% |
0.91% |
85.93 |
|
| £70-75K |
0.61% |
0.72% |
84.29 |
|
| £75-80K |
0.48% |
0.57% |
82.64 |
|
| £80-85K |
0.37% |
0.46% |
80.98 |
|
| £85-90K |
0.30% |
0.37% |
79.32 |
|
| £90-95K |
0.24% |
0.31% |
77.67 |
|
| £95-100K |
0.19% |
0.25% |
76.02 |
|
| £100K + |
0.88% |
1.34% |
65.55 |
|
|
|

|


|
1992-1997
|
1997-2001
|
|
|
|
| Con |
-1.18% |
| Lab |
4.94% |
| LD |
-1.02% |
| SNP |
-3.29% |
|
| Con |
-3.56% |
| Lab |
0.22% |
| LD |
2.42% |
| SNP |
-1.29% |
|
|
 |
Tam Dalyell
Labour hold
|
| Con |
 |
2,836 |
8.96% |
| Lab |
 |
17,207 |
54.36% |
| LD |
 |
2,628 |
8.30% |
| SNP |
 |
8,078 |
25.52% |
| Oth |
 |
906 |
2.86% |
| Maj |
 |
9,129 |
28.84% |
| Turn |
 |
31,655 |
57.98% |
|
|
 |
Tam Dalyell
Labour hold
|
| SSP |
Eddie Cornoch |
695 |
2.20% |
| RRL |
Helen Cornoch |
211 |
0.67% |
| L |
Tam Dalyell |
17,207 |
54.36% |
| C |
Gordon Lindhurst |
2,836 |
8.96% |
| LD |
Martin Oliver |
2,628 |
8.30% |
| SNP |
Jim Sibbald |
8,078 |
25.52% |
|
Candidates representing 6 parties stood for election to this seat.
|
|
 |
Tam Dalyell
Labour
|
| Con |
 |
4,964 |
12.52% |
| Lab |
 |
21,469 |
54.14% |
| LD |
 |
2,331 |
5.88% |
| SNP |
 |
10,631 |
26.81% |
| Ref |
 |
259 |
0.65% |
| Oth |
|
0 |
0.00% |
| Maj |
 |
10,838 |
27.33% |
| Turn |
 |
39,654 |
73.84% |
|
|
 |
|
Labour
|
| Con |
 |
5,613 |
13.70% |
| Lab |
 |
20,137 |
49.20% |
| LD |
 |
2,843 |
6.90% |
| SNP |
 |
12,340 |
30.10% |
| Oth |
|
0 |
0.00% |
| Maj |
 |
7,797 |
19.00% |
| Turn |
 |
40,933 |
77.14% |
|
|
 |
|

|

