|
Liverpool, Garston
Labour hold

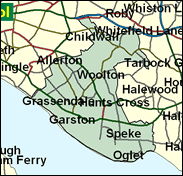
Liverpool is one city in which it is not only wise but positively misleading to try to predict General Election results from local elections. In May 2000 the Liberal Democrats greatly strengthened their grip on the City Council, and won every ward in Garston constituency in south east Liverpool, whether the middle class enclave of Woolton or the huge working class council estate of Speke near the airport of that name. Yet in the 1997 General Election Labour's Maria Eagle received 61pc of votes cast, the Liberal Democrats' Flo Clucas (councillor and deputy leader of the group) just 19pc. Clearly Liverpool thinks that New Labour under Mr Blair and Mr Brown is fit to run the county, but is very wary of the record in office of the local party, going back to the Militant days of Derek Hatton and before.

Maria Eagle, with a similarly monotonously piping voice as, but more humorous and heterosexual than, her twin sister Angela (a junior minister) won here in 1997. A solicitor in Liverpool, she was born in 1961, and educated at Formby High School and Pembroke College, Oxford, and has become identified with legislation to ban fur farming. Herself the product of all-women shortlists, she wants changes to the Sex Discrimination Act to allow their reintroduction to alter the Labour Party’s “traditional male culture.”
 |
| Wealthy Achievers, Suburban Areas |
19.67% |
14.99% |
131.20 |
|
| Affluent Greys, Rural Communities |
0.00% |
2.13% |
0.00 |
|
| Prosperous Pensioners, Retirement Areas |
2.15% |
2.49% |
86.30 |
|
| Affluent Executives, Family Areas |
0.15% |
4.43% |
3.45 |
|
| Well-Off Workers, Family Areas |
1.99% |
7.27% |
27.37 |
|
| Affluent Urbanites, Town & City Areas |
2.13% |
2.56% |
82.88 |
|
| Prosperous Professionals, Metropolitan Areas |
0.57% |
2.04% |
27.80 |
|
| Better-Off Executives, Inner City Areas |
0.61% |
3.94% |
15.41 |
|
| Comfortable Middle Agers, Mature Home Owning Areas |
20.27% |
13.04% |
155.46 |
|
| Skilled Workers, Home Owning Areas |
5.13% |
12.70% |
40.42 |
|
| New Home Owners, Mature Communities |
3.94% |
8.14% |
48.33 |
|
| White Collar Workers, Better-Off Multi Ethnic Areas |
0.52% |
4.02% |
12.99 |
|
| Older People, Less Prosperous Areas |
1.82% |
3.19% |
57.22 |
|
| Council Estate Residents, Better-Off Homes |
32.25% |
11.31% |
285.15 |
|
| Council Estate Residents, High Unemployment |
4.22% |
3.06% |
137.86 |
|
| Council Estate Residents, Greatest Hardship |
4.56% |
2.52% |
181.04 |
|
| People in Multi-Ethnic, Low-Income Areas |
0.00% |
2.10% |
0.00 |
|
| Unclassified |
0.02% |
0.06% |
34.13 |
|
|
 |
 |
 |
| £0-5K |
13.04% |
9.41% |
138.55 |
|
| £5-10K |
19.75% |
16.63% |
118.76 |
|
| £10-15K |
17.35% |
16.58% |
104.64 |
|
| £15-20K |
12.99% |
13.58% |
95.61 |
|
| £20-25K |
9.34% |
10.39% |
89.89 |
|
| £25-30K |
6.70% |
7.77% |
86.22 |
|
| £30-35K |
4.85% |
5.79% |
83.82 |
|
| £35-40K |
3.56% |
4.33% |
82.21 |
|
| £40-45K |
2.65% |
3.27% |
81.12 |
|
| £45-50K |
1.99% |
2.48% |
80.35 |
|
| £50-55K |
1.52% |
1.90% |
79.79 |
|
| £55-60K |
1.17% |
1.47% |
79.37 |
|
| £60-65K |
0.91% |
1.15% |
79.05 |
|
| £65-70K |
0.71% |
0.91% |
78.79 |
|
| £70-75K |
0.57% |
0.72% |
78.57 |
|
| £75-80K |
0.45% |
0.57% |
78.37 |
|
| £80-85K |
0.36% |
0.46% |
78.20 |
|
| £85-90K |
0.29% |
0.37% |
78.04 |
|
| £90-95K |
0.24% |
0.31% |
77.90 |
|
| £95-100K |
0.19% |
0.25% |
77.75 |
|
| £100K + |
1.03% |
1.34% |
76.89 |
|
|
|

|


|
1992-1997
|
1997-2001
|
|
|
|
| Con |
-9.32% |
| Lab |
10.23% |
| LD |
-2.63% |
|
| Con |
-0.19% |
| Lab |
0.06% |
| LD |
4.15% |
|
|
 |
Maria Eagle
Labour hold
|
| Con |
 |
5,059 |
15.49% |
| Lab |
 |
20,043 |
61.39% |
| LD |
 |
7,549 |
23.12% |
| Oth |
|
0 |
0.00% |
| Maj |
 |
12,494 |
38.27% |
| Turn |
 |
32,651 |
50.16% |
|
|
 |
Maria Eagle
Labour hold
|
| L |
Maria Eagle |
20,043 |
61.39% |
| LD |
Paula Keaveney |
7,549 |
23.12% |
| C |
Helen Sutton |
5,059 |
15.49% |
|
Candidates representing 3 parties stood for election to this seat.
|
|
 |
Maria Eagle
Labour
|
| Con |
 |
6,819 |
15.68% |
| Lab |
 |
26,667 |
61.33% |
| LD |
 |
8,250 |
18.97% |
| Ref |
 |
833 |
1.92% |
| Oth |
 |
913 |
2.10% |
| Maj |
 |
18,417 |
42.36% |
| Turn |
 |
43,482 |
65.14% |
|
|
 |
|
Labour
|
| Con |
 |
12,340 |
25.00% |
| Lab |
 |
25,214 |
51.10% |
| LD |
 |
10,680 |
21.60% |
| Oth |
 |
1,104 |
2.20% |
| Maj |
 |
12,874 |
26.10% |
| Turn |
 |
49,338 |
70.87% |
|
|
 |
|

|

