|
Liverpool, Riverside
Liberal Democrat gain

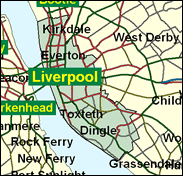
The very heart of Liverpool, Riverside includes the famous sights of the Liver Building and the Albert Dock and all the places associated truly or falsely with Beatles memorabilia, two cathedrals of striking architectural design, and a variety of residential areas from the once grand (Gladstone's Rodney Street still stands, and there are still mansions around Sefton Park, although not put to their original use) to the truly dire and depopulated, in Everton and Vauxhall wards in the northern inner city, through areas of renewal and hope. Nor do conventional politics, even those of the Labour party, seem a source of solutions here. In the most recent City Council elections of May 2000, in Everton ward, for example, an Independent Labour candidate won with 70pc of the vote, ahead of official Labour. The Liberal Democrats scored 55 votes and the Conservatives 15. Over 84pc on the roll did not vote at all.

Louise Ellman, elected here in 1997 after selection from an all-women shortlist, is virtually a one-club politician as a persistent advocate of public-private partnerships of the sort she trailed when leader for 16 years of Lancashire County Council. A severe-seeming critic of Arab activities in the Middle East, she was born in 1945 and educated at Manchester High School for Girls and Hull and York Universities, and originally lectured in further education before becoming a full-time local politician.
 |
| Wealthy Achievers, Suburban Areas |
3.15% |
14.99% |
21.02 |
|
| Affluent Greys, Rural Communities |
0.00% |
2.13% |
0.00 |
|
| Prosperous Pensioners, Retirement Areas |
0.58% |
2.49% |
23.31 |
|
| Affluent Executives, Family Areas |
0.68% |
4.43% |
15.39 |
|
| Well-Off Workers, Family Areas |
0.26% |
7.27% |
3.54 |
|
| Affluent Urbanites, Town & City Areas |
8.20% |
2.56% |
319.75 |
|
| Prosperous Professionals, Metropolitan Areas |
1.71% |
2.04% |
83.70 |
|
| Better-Off Executives, Inner City Areas |
17.34% |
3.94% |
439.76 |
|
| Comfortable Middle Agers, Mature Home Owning Areas |
2.37% |
13.04% |
18.19 |
|
| Skilled Workers, Home Owning Areas |
4.74% |
12.70% |
37.28 |
|
| New Home Owners, Mature Communities |
1.09% |
8.14% |
13.38 |
|
| White Collar Workers, Better-Off Multi Ethnic Areas |
7.82% |
4.02% |
194.42 |
|
| Older People, Less Prosperous Areas |
0.27% |
3.19% |
8.44 |
|
| Council Estate Residents, Better-Off Homes |
29.81% |
11.31% |
263.55 |
|
| Council Estate Residents, High Unemployment |
10.32% |
3.06% |
337.08 |
|
| Council Estate Residents, Greatest Hardship |
9.12% |
2.52% |
362.13 |
|
| People in Multi-Ethnic, Low-Income Areas |
2.51% |
2.10% |
119.44 |
|
| Unclassified |
0.03% |
0.06% |
55.79 |
|
|
 |
 |
 |
| £0-5K |
19.00% |
9.41% |
201.85 |
|
| £5-10K |
23.69% |
16.63% |
142.42 |
|
| £10-15K |
18.13% |
16.58% |
109.34 |
|
| £15-20K |
12.15% |
13.58% |
89.47 |
|
| £20-25K |
7.97% |
10.39% |
76.65 |
|
| £25-30K |
5.28% |
7.77% |
67.87 |
|
| £30-35K |
3.56% |
5.79% |
61.54 |
|
| £35-40K |
2.46% |
4.33% |
56.79 |
|
| £40-45K |
1.73% |
3.27% |
53.10 |
|
| £45-50K |
1.24% |
2.48% |
50.15 |
|
| £50-55K |
0.91% |
1.90% |
47.74 |
|
| £55-60K |
0.67% |
1.47% |
45.72 |
|
| £60-65K |
0.51% |
1.15% |
44.00 |
|
| £65-70K |
0.39% |
0.91% |
42.51 |
|
| £70-75K |
0.30% |
0.72% |
41.21 |
|
| £75-80K |
0.23% |
0.57% |
40.05 |
|
| £80-85K |
0.18% |
0.46% |
39.02 |
|
| £85-90K |
0.14% |
0.37% |
38.09 |
|
| £90-95K |
0.11% |
0.31% |
37.24 |
|
| £95-100K |
0.09% |
0.25% |
36.46 |
|
| £100K + |
0.44% |
1.34% |
32.66 |
|
|
|

|


|
1992-1997
|
1997-2001
|
|
|
|
| Con |
-1.37% |
| Lab |
2.03% |
| LD |
-5.13% |
|
| Con |
-1.13% |
| Lab |
-70.43% |
| LD |
3.40% |
|
|
 |
Louise Ellman
Liberal Democrat gain
|
| Con |
 |
2,142 |
8.40% |
| Lab |
|
0 |
0.00% |
| LD |
 |
4,251 |
16.67% |
| Oth |
 |
19,110 |
74.93% |
| Maj |
 |
2,109 |
8.27% |
| Turn |
 |
25,503 |
34.08% |
|
|
 |
Louise Ellman
Liberal Democrat gain
|
| C |
Judith Edwards |
2,142 |
8.40% |
| LC |
Louise Ellman |
18,201 |
71.37% |
| LD |
Richard Marbrow |
4,251 |
16.67% |
| SA |
Cathy Wilson |
909 |
3.56% |
|
Candidates representing 4 parties stood for election to this seat.
|
|
 |
Louise Ellman
Labour
|
| Con |
 |
3,635 |
9.53% |
| Lab |
 |
26,858 |
70.43% |
| LD |
 |
5,059 |
13.27% |
| Ref |
 |
586 |
1.54% |
| Oth |
 |
1,997 |
5.24% |
| Maj |
 |
21,799 |
57.16% |
| Turn |
 |
38,135 |
51.93% |
|
|
 |
|
Labour
|
| Con |
 |
4,572 |
10.90% |
| Lab |
 |
28,760 |
68.40% |
| LD |
 |
7,744 |
18.40% |
| Oth |
 |
949 |
2.30% |
| Maj |
 |
21,016 |
50.00% |
| Turn |
 |
42,025 |
59.09% |
|
|
 |
|

|

