|
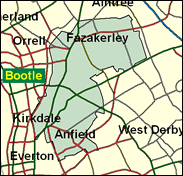
Liverpool, Walton
Labour hold

The seat which was gained from the Conservatives by the left wing Labour stalwart Eric Heffer in 1964 gave 31,516 votes to his successor as Labour MP Peter Kilfoyle, and just 2,551 to the Conservative, in 1997, a gap of 72.1pc. This must rank as just about the largest long-term swing in Britain, and demonstrates the huge change of allegiance and fundamental way of thinking in the great city on the Mersey, which has had so many troubles, and been so ill served by so many politicians, over the closing decades of the twentieth century. Walton now ranks as the fifth safest Labour seat in the whole of the UK.

Peter Kilfoyle is one of the few of Blair’s ministers to have voluntarily resigned rather than be sacked or required to quit. Elected here in the wake of Eric Heffer’s death in 1991, he is an old-style Labour machine politician, whose name was made as the North West Regional organiser who cleared out the Militant infiltration of Liverpool. Born into the working class in 1946, he attended Catholic schools and Durham University from which he dropped out to do manual work for five years, until training as a teacher. A rough-hewn, beefy, Scouse-accented extrovert, his resignation in 1999 as a Defence Minister over Old Labour concern for neglect of the heartlands, was heralded in 1996 when he ridiculed the Mandelson-Liddle tract, The Blair Revolution, as “condescending” and “trite.” His own book Left Behind, published in 2000, savaged Mandelson.
 |
| Wealthy Achievers, Suburban Areas |
0.49% |
14.99% |
3.28 |
|
| Affluent Greys, Rural Communities |
0.33% |
2.13% |
15.29 |
|
| Prosperous Pensioners, Retirement Areas |
0.00% |
2.49% |
0.00 |
|
| Affluent Executives, Family Areas |
0.09% |
4.43% |
2.01 |
|
| Well-Off Workers, Family Areas |
2.03% |
7.27% |
27.96 |
|
| Affluent Urbanites, Town & City Areas |
0.00% |
2.56% |
0.00 |
|
| Prosperous Professionals, Metropolitan Areas |
0.00% |
2.04% |
0.06 |
|
| Better-Off Executives, Inner City Areas |
1.98% |
3.94% |
50.33 |
|
| Comfortable Middle Agers, Mature Home Owning Areas |
3.68% |
13.04% |
28.21 |
|
| Skilled Workers, Home Owning Areas |
30.67% |
12.70% |
241.48 |
|
| New Home Owners, Mature Communities |
0.58% |
8.14% |
7.08 |
|
| White Collar Workers, Better-Off Multi Ethnic Areas |
3.16% |
4.02% |
78.51 |
|
| Older People, Less Prosperous Areas |
1.33% |
3.19% |
41.91 |
|
| Council Estate Residents, Better-Off Homes |
49.98% |
11.31% |
441.85 |
|
| Council Estate Residents, High Unemployment |
4.27% |
3.06% |
139.52 |
|
| Council Estate Residents, Greatest Hardship |
1.40% |
2.52% |
55.69 |
|
| People in Multi-Ethnic, Low-Income Areas |
0.00% |
2.10% |
0.00 |
|
| Unclassified |
0.00% |
0.06% |
1.81 |
|
|
 |
 |
 |
| £0-5K |
15.84% |
9.41% |
168.23 |
|
| £5-10K |
24.17% |
16.63% |
145.34 |
|
| £10-15K |
20.23% |
16.58% |
122.00 |
|
| £15-20K |
13.90% |
13.58% |
102.35 |
|
| £20-25K |
8.98% |
10.39% |
86.37 |
|
| £25-30K |
5.71% |
7.77% |
73.44 |
|
| £30-35K |
3.65% |
5.79% |
62.96 |
|
| £35-40K |
2.36% |
4.33% |
54.43 |
|
| £40-45K |
1.55% |
3.27% |
47.45 |
|
| £45-50K |
1.03% |
2.48% |
41.68 |
|
| £50-55K |
0.70% |
1.90% |
36.89 |
|
| £55-60K |
0.48% |
1.47% |
32.87 |
|
| £60-65K |
0.34% |
1.15% |
29.48 |
|
| £65-70K |
0.24% |
0.91% |
26.60 |
|
| £70-75K |
0.17% |
0.72% |
24.13 |
|
| £75-80K |
0.13% |
0.57% |
22.00 |
|
| £80-85K |
0.09% |
0.46% |
20.16 |
|
| £85-90K |
0.07% |
0.37% |
18.55 |
|
| £90-95K |
0.05% |
0.31% |
17.14 |
|
| £95-100K |
0.04% |
0.25% |
15.90 |
|
| £100K + |
0.15% |
1.34% |
11.01 |
|
|
|

|


|
1992-1997
|
1997-2001
|
|
|
|
| Con |
-6.16% |
| Lab |
5.98% |
| LD |
-0.86% |
|
| Con |
-0.28% |
| Lab |
-0.57% |
| LD |
3.43% |
|
|
 |
Peter Kilfoyle
Labour hold
|
| Con |
 |
1,726 |
6.07% |
| Lab |
 |
22,143 |
77.81% |
| LD |
 |
4,147 |
14.57% |
| Oth |
 |
442 |
1.55% |
| Maj |
 |
17,996 |
63.24% |
| Turn |
 |
28,458 |
42.96% |
|
|
 |
Peter Kilfoyle
Labour hold
|
| UK |
Paul Forrest |
442 |
1.55% |
| C |
Stephen Horgan |
1,726 |
6.07% |
| L |
Peter Kilfoyle |
22,143 |
77.81% |
| LD |
Kiron Reid |
4,147 |
14.57% |
|
Candidates representing 4 parties stood for election to this seat.
|
|
 |
Peter Kilfoyle
Labour
|
| Con |
 |
2,551 |
6.34% |
| Lab |
 |
31,516 |
78.38% |
| LD |
 |
4,478 |
11.14% |
| Ref |
 |
620 |
1.54% |
| Oth |
 |
1,042 |
2.59% |
| Maj |
 |
27,038 |
67.25% |
| Turn |
 |
40,207 |
59.54% |
|
|
 |
|
Labour
|
| Con |
 |
5,915 |
12.50% |
| Lab |
 |
34,214 |
72.40% |
| LD |
 |
5,672 |
12.00% |
| Oth |
 |
1,454 |
3.10% |
| Maj |
 |
28,299 |
59.90% |
| Turn |
 |
47,255 |
66.40% |
|
|
 |
|

|

