|
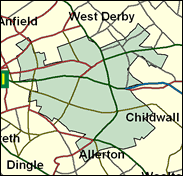
Liverpool, Wavertree
Labour hold

The Liberal Democrats' dominance of Liverpool City Council has never been consistently translated into success in parliamentary elections in the city, and remains tied closely to its peculiar municipal history and the untypicality of its local Labour Party. Tony Blair can rely on all five of Liverpool's seats in the next election at national level, for the government of the whole land. This even includes Wavertree, where the LDs swept all five wards very easily in the most recent Liverpool elections in May 2000, at a time when they took 26 of the council seats available in the city as a whole to Labour's six (they also took all the wards in Garston).

Jane Kennedy, a junior minister in the Lord Chancellor’s Department after five years as a Whip, was first elected in 1992, as a replacement for the expelled Militant-supporting Terry Fields, and as the first woman MP in Liverpool since Bessie Braddock, than whom she was substantially more photogenic and less physiologically preoccupied by turnstiles in ladies lavatories. Part of the Labour clean-up team to rid Liverpool of Militant, she was born in 1958, attended Haughton Comprehensive School and, inconclusively, Liverpool University. She rose politically as a NUPE/Unison official. A Zionist, she joined the Lord Chancellor’s team as the only non-lawyer.
 |
| Wealthy Achievers, Suburban Areas |
9.99% |
14.99% |
66.64 |
|
| Affluent Greys, Rural Communities |
0.00% |
2.13% |
0.00 |
|
| Prosperous Pensioners, Retirement Areas |
0.18% |
2.49% |
7.25 |
|
| Affluent Executives, Family Areas |
0.00% |
4.43% |
0.00 |
|
| Well-Off Workers, Family Areas |
1.17% |
7.27% |
16.09 |
|
| Affluent Urbanites, Town & City Areas |
5.24% |
2.56% |
204.39 |
|
| Prosperous Professionals, Metropolitan Areas |
0.21% |
2.04% |
10.08 |
|
| Better-Off Executives, Inner City Areas |
6.27% |
3.94% |
158.97 |
|
| Comfortable Middle Agers, Mature Home Owning Areas |
11.94% |
13.04% |
91.53 |
|
| Skilled Workers, Home Owning Areas |
21.36% |
12.70% |
168.14 |
|
| New Home Owners, Mature Communities |
2.41% |
8.14% |
29.63 |
|
| White Collar Workers, Better-Off Multi Ethnic Areas |
4.92% |
4.02% |
122.26 |
|
| Older People, Less Prosperous Areas |
1.73% |
3.19% |
54.40 |
|
| Council Estate Residents, Better-Off Homes |
32.16% |
11.31% |
284.31 |
|
| Council Estate Residents, High Unemployment |
2.30% |
3.06% |
75.15 |
|
| Council Estate Residents, Greatest Hardship |
0.13% |
2.52% |
4.99 |
|
| People in Multi-Ethnic, Low-Income Areas |
0.00% |
2.10% |
0.00 |
|
| Unclassified |
0.00% |
0.06% |
0.00 |
|
|
 |
 |
 |
| £0-5K |
13.79% |
9.41% |
146.48 |
|
| £5-10K |
20.92% |
16.63% |
125.76 |
|
| £10-15K |
18.32% |
16.58% |
110.48 |
|
| £15-20K |
13.44% |
13.58% |
98.95 |
|
| £20-25K |
9.37% |
10.39% |
90.18 |
|
| £25-30K |
6.49% |
7.77% |
83.43 |
|
| £30-35K |
4.53% |
5.79% |
78.16 |
|
| £35-40K |
3.21% |
4.33% |
74.00 |
|
| £40-45K |
2.31% |
3.27% |
70.67 |
|
| £45-50K |
1.69% |
2.48% |
67.97 |
|
| £50-55K |
1.25% |
1.90% |
65.74 |
|
| £55-60K |
0.94% |
1.47% |
63.90 |
|
| £60-65K |
0.72% |
1.15% |
62.34 |
|
| £65-70K |
0.55% |
0.91% |
61.02 |
|
| £70-75K |
0.43% |
0.72% |
59.89 |
|
| £75-80K |
0.34% |
0.57% |
58.91 |
|
| £80-85K |
0.27% |
0.46% |
58.05 |
|
| £85-90K |
0.21% |
0.37% |
57.30 |
|
| £90-95K |
0.17% |
0.31% |
56.63 |
|
| £95-100K |
0.14% |
0.25% |
56.03 |
|
| £100K + |
0.72% |
1.34% |
53.34 |
|
|
|

|


|
1992-1997
|
1997-2001
|
|
|
|
| Con |
-1.73% |
| Lab |
23.15% |
| LD |
-13.16% |
|
| Con |
-1.15% |
| Lab |
-1.73% |
| LD |
2.84% |
|
|
 |
Jane Kennedy
Labour hold
|
| Con |
 |
3,091 |
9.62% |
| Lab |
 |
20,155 |
62.71% |
| LD |
 |
7,836 |
24.38% |
| Oth |
 |
1,056 |
3.29% |
| Maj |
 |
12,319 |
38.33% |
| Turn |
 |
32,138 |
44.29% |
|
|
 |
Jane Kennedy
Labour hold
|
| C |
Geoffrey Allen |
3,091 |
9.62% |
| L |
Jane Kennedy |
20,155 |
62.71% |
| SL |
Michael Lane |
359 |
1.12% |
| UK |
Neil Miney |
348 |
1.08% |
| LD |
Christopher Newby |
7,836 |
24.38% |
| SA |
Mark O'Brien |
349 |
1.09% |
|
Candidates representing 6 parties stood for election to this seat.
|
|
 |
Jane Kennedy
Labour
|
| Con |
 |
4,944 |
10.77% |
| Lab |
 |
29,592 |
64.45% |
| LD |
 |
9,891 |
21.54% |
| Ref |
 |
576 |
1.25% |
| Oth |
 |
915 |
1.99% |
| Maj |
 |
19,701 |
42.90% |
| Turn |
 |
45,918 |
62.85% |
|
|
 |
|
Labour
|
| Con |
 |
6,422 |
12.50% |
| Lab |
 |
21,237 |
41.30% |
| LD |
 |
17,857 |
34.70% |
| Oth |
 |
5,899 |
11.50% |
| Maj |
 |
3,380 |
6.60% |
| Turn |
 |
51,415 |
70.34% |
|
|
 |
|

|

