|
Bedford
Labour hold

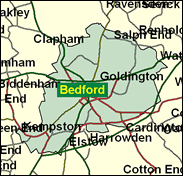
In the boundary changes that came into effect in 1997, Bedford was reduced to the core of the town itself, which helped Labour to win it for the first time since 1966. Bedford is a very interesting, cosmopolitan town, with a surprisingly heady mixture of ethnic groups which includes the country's highest proportion of Italians, who came over to work in the brickfields still visible outside the town. It has affluent residential areas, including those catering for commuters to London; fine educational provision and a rich history including such luminaries as John Bunyan, and a wide mix of employers from brewers to the county council. Even in the exceptional circumstances of the June 1999 Euro-elections (a turnout of 25pc) Labour retained a small lead in Bedford - by 207 votes. This indicates that their first-term MP Patrick Hall can probably look forward to being returned.

Elected in 1997, Patrick Hall, a half-Belgian bachelor, is Labour's third only MP for Bedford since 1945. A former town planner and as an MP a very unobtrusive Blairite loyalist, he was born in 1951 and educated at the local public school, Bedford Modern, and at Birmingham University. Naïve-seeming, to Tory laughter he claimed many of his constituents supported ‘the government's commitment to the flexible and speedy implementation of the heavily-indebted poor countries initiative'. Though tabling only six written questions in his first year, he favours electoral reform, more accountable banks, the east of England as a separate region, and planning advice to avoid building on flood plains. He will have to hope this will be enough to make him the first ever Labour MP for Bedford to win a second term.
 |
| Wealthy Achievers, Suburban Areas |
9.08% |
14.99% |
60.58 |
|
| Affluent Greys, Rural Communities |
0.00% |
2.13% |
0.00 |
|
| Prosperous Pensioners, Retirement Areas |
1.60% |
2.49% |
64.37 |
|
| Affluent Executives, Family Areas |
6.05% |
4.43% |
136.77 |
|
| Well-Off Workers, Family Areas |
9.46% |
7.27% |
130.08 |
|
| Affluent Urbanites, Town & City Areas |
2.77% |
2.56% |
108.12 |
|
| Prosperous Professionals, Metropolitan Areas |
1.18% |
2.04% |
57.92 |
|
| Better-Off Executives, Inner City Areas |
7.74% |
3.94% |
196.17 |
|
| Comfortable Middle Agers, Mature Home Owning Areas |
12.72% |
13.04% |
97.56 |
|
| Skilled Workers, Home Owning Areas |
12.00% |
12.70% |
94.46 |
|
| New Home Owners, Mature Communities |
5.62% |
8.14% |
68.98 |
|
| White Collar Workers, Better-Off Multi Ethnic Areas |
4.50% |
4.02% |
111.87 |
|
| Older People, Less Prosperous Areas |
2.57% |
3.19% |
80.54 |
|
| Council Estate Residents, Better-Off Homes |
17.27% |
11.31% |
152.65 |
|
| Council Estate Residents, High Unemployment |
1.73% |
3.06% |
56.61 |
|
| Council Estate Residents, Greatest Hardship |
2.31% |
2.52% |
91.54 |
|
| People in Multi-Ethnic, Low-Income Areas |
3.40% |
2.10% |
161.99 |
|
| Unclassified |
0.00% |
0.06% |
5.04 |
|
|
 |
 |
 |
| £0-5K |
9.98% |
9.41% |
106.02 |
|
| £5-10K |
16.29% |
16.63% |
97.95 |
|
| £10-15K |
16.13% |
16.58% |
97.31 |
|
| £15-20K |
13.34% |
13.58% |
98.18 |
|
| £20-25K |
10.32% |
10.39% |
99.31 |
|
| £25-30K |
7.80% |
7.77% |
100.33 |
|
| £30-35K |
5.86% |
5.79% |
101.15 |
|
| £35-40K |
4.41% |
4.33% |
101.76 |
|
| £40-45K |
3.34% |
3.27% |
102.21 |
|
| £45-50K |
2.54% |
2.48% |
102.51 |
|
| £50-55K |
1.96% |
1.90% |
102.70 |
|
| £55-60K |
1.52% |
1.47% |
102.81 |
|
| £60-65K |
1.18% |
1.15% |
102.86 |
|
| £65-70K |
0.93% |
0.91% |
102.86 |
|
| £70-75K |
0.74% |
0.72% |
102.84 |
|
| £75-80K |
0.59% |
0.57% |
102.80 |
|
| £80-85K |
0.48% |
0.46% |
102.75 |
|
| £85-90K |
0.38% |
0.37% |
102.69 |
|
| £90-95K |
0.31% |
0.31% |
102.63 |
|
| £95-100K |
0.26% |
0.25% |
102.58 |
|
| £100K + |
1.38% |
1.34% |
102.70 |
|
|
|

|


|
1992-1997
|
1997-2001
|
|
|
|
| Con |
-11.74% |
| Lab |
14.22% |
| LD |
-4.05% |
|
| Con |
-0.89% |
| Lab |
-2.68% |
| LD |
3.48% |
|
|
 |
Patrick Hall
Labour hold
|
| Con |
 |
13,297 |
32.77% |
| Lab |
 |
19,454 |
47.94% |
| LD |
 |
6,425 |
15.83% |
| Oth |
 |
1,403 |
3.46% |
| Maj |
 |
6,157 |
15.17% |
| Turn |
 |
40,579 |
59.88% |
|
|
 |
Patrick Hall
Labour hold
|
| C |
Nicky Attenborough |
13,297 |
32.77% |
| L |
Patrick Hall |
19,454 |
47.94% |
| LD |
Michael Headley |
6,425 |
15.83% |
| UK |
Jennifer Lo Bianco |
430 |
1.06% |
| I |
Richard Rawlins |
973 |
2.40% |
|
Candidates representing 5 parties stood for election to this seat.
|
|
 |
Patrick Hall
Labour gain
|
| Con |
 |
16,474 |
33.66% |
| Lab |
 |
24,774 |
50.62% |
| LD |
 |
6,044 |
12.35% |
| Ref |
 |
1,503 |
3.07% |
| Oth |
 |
149 |
0.30% |
| Maj |
 |
8,300 |
16.96% |
| Turn |
 |
48,944 |
73.53% |
|
|
 |
|
Conservative
|
| Con |
 |
22,863 |
45.40% |
| Lab |
 |
18,318 |
36.40% |
| LD |
 |
8,263 |
16.40% |
| Oth |
 |
881 |
1.80% |
| Maj |
 |
4,545 |
9.00% |
| Turn |
 |
50,325 |
76.52% |
|
|
 |
|

|

