|
Livingston
Labour hold

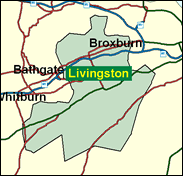
The Foreign Secretary's job takes him around the world in his nation's interest. Back home is an unglamorous constituency, the New Town of Livingston, designated as such in 1962, and despite the assertions of a consistently misspelt Guardian feature in April 2001 not named after the explorer David Livingstone. Livingston without the "e" has a relatively high level of social problems including recourse to mental health services and poorer housing than New Towns in say the south east of England. The SNP are clearly second, but as in so many parts of Scotland, they do not do quite well enough to challenge Labour for victory at present. Robin Cook can in all probability rest assured that his base will not cause him additional headaches as he strives to solve the problems of the rest of the wide world.

Robin Cook, after being Foreign Secretary for four years, and confirming that the Special Relationship is in the safe hands of a former unilateralist, would seem hard to reshuffle in a new Blair Government, and even harder in a Government led by his longtime fellow Scots adversary Gordon Brown. Born 1946 and educated at Aberdeen Grammar School, Royal High School, Edinburgh and Edinburgh University, he was elected at the age of 28 in 1974 and advanced as a soft left-winger who backed unilateralism, opposed devolution and, under Blair, initially resisted the Clause Four re-write. A resistantly-bearded ambitious loner without obvious charm, but for his highly public and messy dropping of his wife, he might have had the eventual option of being Prime Minister of Scotland.
 |
| Wealthy Achievers, Suburban Areas |
2.26% |
14.99% |
15.04 |
|
| Affluent Greys, Rural Communities |
0.00% |
2.13% |
0.00 |
|
| Prosperous Pensioners, Retirement Areas |
0.00% |
2.49% |
0.00 |
|
| Affluent Executives, Family Areas |
15.21% |
4.43% |
343.66 |
|
| Well-Off Workers, Family Areas |
12.55% |
7.27% |
172.52 |
|
| Affluent Urbanites, Town & City Areas |
2.77% |
2.56% |
108.04 |
|
| Prosperous Professionals, Metropolitan Areas |
0.00% |
2.04% |
0.00 |
|
| Better-Off Executives, Inner City Areas |
0.22% |
3.94% |
5.65 |
|
| Comfortable Middle Agers, Mature Home Owning Areas |
0.31% |
13.04% |
2.41 |
|
| Skilled Workers, Home Owning Areas |
9.72% |
12.70% |
76.51 |
|
| New Home Owners, Mature Communities |
4.00% |
8.14% |
49.08 |
|
| White Collar Workers, Better-Off Multi Ethnic Areas |
0.00% |
4.02% |
0.00 |
|
| Older People, Less Prosperous Areas |
3.51% |
3.19% |
110.31 |
|
| Council Estate Residents, Better-Off Homes |
43.84% |
11.31% |
387.63 |
|
| Council Estate Residents, High Unemployment |
2.46% |
3.06% |
80.39 |
|
| Council Estate Residents, Greatest Hardship |
3.15% |
2.52% |
124.89 |
|
| People in Multi-Ethnic, Low-Income Areas |
0.00% |
2.10% |
0.00 |
|
| Unclassified |
0.00% |
0.06% |
0.00 |
|
|
 |
 |
 |
| £0-5K |
7.47% |
9.41% |
79.38 |
|
| £5-10K |
15.86% |
16.63% |
95.33 |
|
| £10-15K |
17.08% |
16.58% |
103.04 |
|
| £15-20K |
14.52% |
13.58% |
106.87 |
|
| £20-25K |
11.28% |
10.39% |
108.54 |
|
| £25-30K |
8.46% |
7.77% |
108.84 |
|
| £30-35K |
6.26% |
5.79% |
108.16 |
|
| £35-40K |
4.63% |
4.33% |
106.75 |
|
| £40-45K |
3.42% |
3.27% |
104.77 |
|
| £45-50K |
2.54% |
2.48% |
102.36 |
|
| £50-55K |
1.90% |
1.90% |
99.63 |
|
| £55-60K |
1.43% |
1.47% |
96.68 |
|
| £60-65K |
1.08% |
1.15% |
93.57 |
|
| £65-70K |
0.82% |
0.91% |
90.38 |
|
| £70-75K |
0.63% |
0.72% |
87.16 |
|
| £75-80K |
0.48% |
0.57% |
83.95 |
|
| £80-85K |
0.37% |
0.46% |
80.77 |
|
| £85-90K |
0.29% |
0.37% |
77.65 |
|
| £90-95K |
0.23% |
0.31% |
74.62 |
|
| £95-100K |
0.18% |
0.25% |
71.68 |
|
| £100K + |
0.75% |
1.34% |
55.62 |
|
|
|

|


|
1992-1997
|
1997-2001
|
|
|
|
| Con |
-8.70% |
| Lab |
9.09% |
| LD |
-2.39% |
| SNP |
1.56% |
|
| Con |
-1.09% |
| Lab |
-1.86% |
| LD |
4.30% |
| SNP |
-3.89% |
|
|
 |
Robin Cook
Labour hold
|
| Con |
 |
2,995 |
8.31% |
| Lab |
 |
19,108 |
53.03% |
| LD |
 |
3,969 |
11.01% |
| SNP |
 |
8,492 |
23.57% |
| Oth |
 |
1,469 |
4.08% |
| Maj |
 |
10,616 |
29.46% |
| Turn |
 |
36,033 |
55.56% |
|
|
 |
Robin Cook
Labour hold
|
| L |
Robin Cook |
19,108 |
53.03% |
| UK |
Robert Kingdon |
359 |
1.00% |
| LD |
Gordon Mackenzie |
3,969 |
11.01% |
| SSP |
Wendy Milne |
1,110 |
3.08% |
| C |
Ian Mowat |
2,995 |
8.31% |
| SNP |
Graham Sutherland |
8,492 |
23.57% |
|
Candidates representing 6 parties stood for election to this seat.
|
|
 |
Robin Cook
Labour
|
| Con |
 |
4,028 |
9.40% |
| Lab |
 |
23,510 |
54.89% |
| LD |
 |
2,876 |
6.71% |
| SNP |
 |
11,763 |
27.46% |
| Ref |
 |
444 |
1.04% |
| Oth |
 |
213 |
0.50% |
| Maj |
 |
11,747 |
27.42% |
| Turn |
 |
42,834 |
71.04% |
|
|
 |
|
Labour
|
| Con |
 |
7,689 |
18.10% |
| Lab |
 |
19,461 |
45.80% |
| LD |
 |
3,857 |
9.10% |
| SNP |
 |
11,013 |
25.90% |
| Oth |
 |
425 |
1.00% |
| Maj |
 |
8,448 |
19.90% |
| Turn |
 |
42,445 |
73.10% |
|
|
 |
|

|

