|
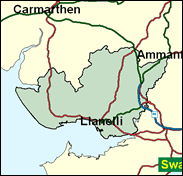
Llanelli
Labour hold

Denzil Davies has had a colourful career, but this westernmost of the great folded valley seats of South Wales, its economy forged by anthracite coal mining and as Britain's greatest tinplate manufacturing centre, has always remained loyal to him. But not to Labour any more, since in 1999 Plaid Cymru's Helen Mary Jones came out on top in the constituency section of the Welsh Assembly elections, beating Labour's Ann Garrard by 688 votes. This may well not be repeated in a General Election against Denzil Davies, MP here for over 30 years, but should prove a drastic shock against any complacency within the local party. Nor is the PC vote so clearly reducible as in seats like Rhondda and Islwyn further east where they delivered other blows with a pointed stick in 1999, for Llanelli is nearly half Welsh speaking - that western factor is important, and at the very least it may be predicted that the Plaid will get more than 19pc next time, and Labour less than 55pc.

Denzil Davies, Labour MP, first elected here in 1970 (and then replacing Jim Griffiths who had himself held the seat for 36 years) is a Euro- and Devo-sceptic Labour veteran out of step with the younger generation of Welsh Labour MPs. Born 1938, and educated at Queen Elizabeth’s Grammar School, Carmarthen and Pembroke College, Oxford, he reverted to practice at the Bar once his frontbench career aborted under Kinnock in 1988. His political incorrectness on Europe and devolution, which he saw as “the unbundling of the British state”, is matched by his wife Ann Carlton’s dismissive view of all-women shortlists. And he votes against homosexual sex at 16.
 |
| Wealthy Achievers, Suburban Areas |
5.46% |
14.99% |
36.45 |
|
| Affluent Greys, Rural Communities |
0.37% |
2.13% |
17.53 |
|
| Prosperous Pensioners, Retirement Areas |
0.66% |
2.49% |
26.66 |
|
| Affluent Executives, Family Areas |
1.31% |
4.43% |
29.65 |
|
| Well-Off Workers, Family Areas |
1.96% |
7.27% |
26.89 |
|
| Affluent Urbanites, Town & City Areas |
0.00% |
2.56% |
0.00 |
|
| Prosperous Professionals, Metropolitan Areas |
0.00% |
2.04% |
0.00 |
|
| Better-Off Executives, Inner City Areas |
0.00% |
3.94% |
0.00 |
|
| Comfortable Middle Agers, Mature Home Owning Areas |
18.11% |
13.04% |
138.91 |
|
| Skilled Workers, Home Owning Areas |
26.92% |
12.70% |
211.89 |
|
| New Home Owners, Mature Communities |
32.66% |
8.14% |
401.05 |
|
| White Collar Workers, Better-Off Multi Ethnic Areas |
1.19% |
4.02% |
29.63 |
|
| Older People, Less Prosperous Areas |
5.09% |
3.19% |
159.89 |
|
| Council Estate Residents, Better-Off Homes |
5.66% |
11.31% |
50.01 |
|
| Council Estate Residents, High Unemployment |
0.39% |
3.06% |
12.61 |
|
| Council Estate Residents, Greatest Hardship |
0.22% |
2.52% |
8.59 |
|
| People in Multi-Ethnic, Low-Income Areas |
0.00% |
2.10% |
0.00 |
|
| Unclassified |
0.00% |
0.06% |
0.00 |
|
|
 |
 |
 |
| £0-5K |
12.07% |
9.41% |
128.22 |
|
| £5-10K |
21.31% |
16.63% |
128.14 |
|
| £10-15K |
19.77% |
16.58% |
119.26 |
|
| £15-20K |
14.69% |
13.58% |
108.17 |
|
| £20-25K |
10.11% |
10.39% |
97.29 |
|
| £25-30K |
6.80% |
7.77% |
87.44 |
|
| £30-35K |
4.56% |
5.79% |
78.78 |
|
| £35-40K |
3.09% |
4.33% |
71.26 |
|
| £40-45K |
2.11% |
3.27% |
64.75 |
|
| £45-50K |
1.47% |
2.48% |
59.12 |
|
| £50-55K |
1.03% |
1.90% |
54.24 |
|
| £55-60K |
0.74% |
1.47% |
49.99 |
|
| £60-65K |
0.53% |
1.15% |
46.26 |
|
| £65-70K |
0.39% |
0.91% |
42.99 |
|
| £70-75K |
0.29% |
0.72% |
40.10 |
|
| £75-80K |
0.22% |
0.57% |
37.54 |
|
| £80-85K |
0.16% |
0.46% |
35.26 |
|
| £85-90K |
0.12% |
0.37% |
33.21 |
|
| £90-95K |
0.10% |
0.31% |
31.37 |
|
| £95-100K |
0.07% |
0.25% |
29.71 |
|
| £100K + |
0.30% |
1.34% |
22.52 |
|
|
|

|


|
1992-1997
|
1997-2001
|
|
|
|
| Con |
-4.86% |
| Lab |
3.38% |
| LD |
-3.61% |
| PC |
3.26% |
|
| Con |
-2.63% |
| Lab |
-9.29% |
| LD |
-0.72% |
| PC |
11.94% |
|
|
 |
Denzil Davies
Labour hold
|
| Con |
 |
3,442 |
9.51% |
| Lab |
 |
17,586 |
48.58% |
| LD |
 |
3,065 |
8.47% |
| PC |
 |
11,183 |
30.89% |
| Oth |
 |
922 |
2.55% |
| Maj |
 |
6,403 |
17.69% |
| Turn |
 |
36,198 |
62.25% |
|
|
 |
Denzil Davies
Labour hold
|
| G |
Jan Cliff |
515 |
1.42% |
| L |
Denzil Davies |
17,586 |
48.58% |
| C |
Simon Hayes |
3,442 |
9.51% |
| PC |
Dyfan Jones |
11,183 |
30.89% |
| LD |
Ken Rees |
3,065 |
8.47% |
| SL |
John Willock |
407 |
1.12% |
|
Candidates representing 6 parties stood for election to this seat.
|
|
 |
Denzil Davies
Labour
|
| Con |
 |
5,003 |
12.14% |
| Lab |
 |
23,851 |
57.88% |
| LD |
 |
3,788 |
9.19% |
| PC |
 |
7,812 |
18.96% |
| Ref |
|
0 |
0.00% |
| Oth |
 |
757 |
1.84% |
| Maj |
 |
16,039 |
38.92% |
| Turn |
 |
41,211 |
70.66% |
|
|
 |
|
Labour
|
| Con |
 |
7,851 |
17.00% |
| Lab |
 |
25,122 |
54.50% |
| LD |
 |
5,884 |
12.80% |
| PC |
 |
7,253 |
15.70% |
| Oth |
|
0 |
0.00% |
| Maj |
 |
17,271 |
37.50% |
| Turn |
 |
46,110 |
77.20% |
|
|
 |
|

|

