|
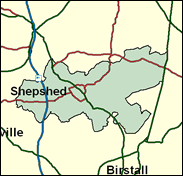
Loughborough
Conservative gain

A key marginal at any General Election in 2001, Loughborough is likely to fall to the Tories if they can cut Labour's overall majority below 40, which means entering territory where an overall majority is considerably unsafe, while William Hague's leadership of the Conservatives would probably be preserved. So, all to fight for in this mixed East Midlands division. In the May 1999 local elections, Labour returned 22 councillors here to the Tories' 8, with third parties nowhere. This may well be a good guide to the likely outcome of the General Election here in Loughborough - and in the UK.

Andy Reed, a short, eager loyalist, was elected in 1997 and dismissed by Red Pepper as “well-presented and good with the media, (but) no politics whatsoever,” and seen as resembling one of those cherubs puffing the breeze from the corners of ancient maps. As local as local gets, born 1946, he was schooled at secondary schools in Birstall in the Leicester suburbs, attended Leicester Polytechnic and worked for Leicestershire County Council variously on urban regeneration, economic development, employment and European affairs for nine years. He is churchy, plays rugby, likes the internet, poses stooge questions and backs East Midlands regionalism.
 |
| Wealthy Achievers, Suburban Areas |
20.51% |
14.99% |
136.78 |
|
| Affluent Greys, Rural Communities |
0.00% |
2.13% |
0.00 |
|
| Prosperous Pensioners, Retirement Areas |
1.16% |
2.49% |
46.52 |
|
| Affluent Executives, Family Areas |
6.80% |
4.43% |
153.77 |
|
| Well-Off Workers, Family Areas |
17.06% |
7.27% |
234.61 |
|
| Affluent Urbanites, Town & City Areas |
0.51% |
2.56% |
19.80 |
|
| Prosperous Professionals, Metropolitan Areas |
0.94% |
2.04% |
46.10 |
|
| Better-Off Executives, Inner City Areas |
2.83% |
3.94% |
71.72 |
|
| Comfortable Middle Agers, Mature Home Owning Areas |
8.22% |
13.04% |
63.07 |
|
| Skilled Workers, Home Owning Areas |
12.66% |
12.70% |
99.67 |
|
| New Home Owners, Mature Communities |
7.84% |
8.14% |
96.23 |
|
| White Collar Workers, Better-Off Multi Ethnic Areas |
2.16% |
4.02% |
53.66 |
|
| Older People, Less Prosperous Areas |
4.02% |
3.19% |
126.25 |
|
| Council Estate Residents, Better-Off Homes |
9.16% |
11.31% |
80.96 |
|
| Council Estate Residents, High Unemployment |
2.28% |
3.06% |
74.44 |
|
| Council Estate Residents, Greatest Hardship |
2.14% |
2.52% |
85.09 |
|
| People in Multi-Ethnic, Low-Income Areas |
1.04% |
2.10% |
49.40 |
|
| Unclassified |
0.67% |
0.06% |
1,075.19 |
|
|
 |
 |
 |
| £0-5K |
9.66% |
9.41% |
102.57 |
|
| £5-10K |
16.86% |
16.63% |
101.36 |
|
| £10-15K |
17.00% |
16.58% |
102.53 |
|
| £15-20K |
13.98% |
13.58% |
102.96 |
|
| £20-25K |
10.65% |
10.39% |
102.52 |
|
| £25-30K |
7.89% |
7.77% |
101.45 |
|
| £30-35K |
5.79% |
5.79% |
100.00 |
|
| £35-40K |
4.26% |
4.33% |
98.34 |
|
| £40-45K |
3.15% |
3.27% |
96.61 |
|
| £45-50K |
2.36% |
2.48% |
94.90 |
|
| £50-55K |
1.78% |
1.90% |
93.24 |
|
| £55-60K |
1.35% |
1.47% |
91.67 |
|
| £60-65K |
1.04% |
1.15% |
90.19 |
|
| £65-70K |
0.81% |
0.91% |
88.81 |
|
| £70-75K |
0.63% |
0.72% |
87.53 |
|
| £75-80K |
0.50% |
0.57% |
86.34 |
|
| £80-85K |
0.39% |
0.46% |
85.23 |
|
| £85-90K |
0.32% |
0.37% |
84.21 |
|
| £90-95K |
0.25% |
0.31% |
83.25 |
|
| £95-100K |
0.21% |
0.25% |
82.37 |
|
| £100K + |
1.05% |
1.34% |
78.01 |
|
|
|

|


|
1992-1997
|
1997-2001
|
|
|
|
| Con |
-9.11% |
| Lab |
8.80% |
| LD |
0.52% |
|
| Con |
-2.35% |
| Lab |
-48.60% |
| LD |
0.98% |
|
|
 |
Andrew Reed
Conservative gain
|
| Con |
 |
15,638 |
35.34% |
| Lab |
|
0 |
0.00% |
| LD |
 |
5,667 |
12.81% |
| Oth |
 |
22,949 |
51.86% |
| Maj |
 |
9,971 |
22.53% |
| Turn |
 |
44,254 |
63.15% |
|
|
 |
Andrew Reed
Conservative gain
|
| UK |
John Bigger |
933 |
2.11% |
| C |
Neil Lyon |
15,638 |
35.34% |
| LC |
Andrew Reed |
22,016 |
49.75% |
| LD |
Julie Simons |
5,667 |
12.81% |
|
Candidates representing 4 parties stood for election to this seat.
|
|
 |
Andy Reed
Labour gain
|
| Con |
 |
19,736 |
37.69% |
| Lab |
 |
25,448 |
48.60% |
| LD |
 |
6,190 |
11.82% |
| Ref |
 |
991 |
1.89% |
| Oth |
|
0 |
0.00% |
| Maj |
 |
5,712 |
10.91% |
| Turn |
 |
52,365 |
75.95% |
|
|
 |
|
Conservative
|
| Con |
 |
23,412 |
46.80% |
| Lab |
 |
19,920 |
39.80% |
| LD |
 |
5,635 |
11.30% |
| Oth |
 |
1,081 |
2.20% |
| Maj |
 |
3,492 |
7.00% |
| Turn |
 |
50,048 |
76.81% |
|
|
 |
|

|

