|
Louth & Horncastle
Conservative hold

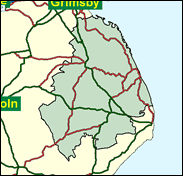
This attractive seat in the Lincolnshire Wolds, an unexpected and relatively unknown part of that eastern county, should remain very safe for Sir Peter Tapsell, who will thus come out of the next Election as the oldest Conservative MP. Here we have the hilltop town of Louth overlooked by a towering church spire, which was known in the nineteenth century as the "nest of rooks" because of its preponderance of black-coated Church of England clergymen, who felt more comfortable here than in their absentee parishes down in the flatter parts of Lincolnshire, which were left open to the alternative appeal of the more plebeian and radical Primitive Methodists - a case of the 'Tory party in flight', perhaps. These Wolds are also known for originating or harbouring the varied talents in versification of Alfred Lord Tennyson and Elton John's lyricist Bernie Taupin.
There must be something in the air.

Sir Peter Tapsell will emerge from the election as the lone Conservative survivor from the 1950s, having been elected in 1959 at Nottingham West. Losing the seat back to Labour in 1964, he migrated to Lincolnshire where he has been an MP since 1965. A Tonbridge and Merton College, Oxford-educated stockbroker, he was born in 1930, the son of a Malayan rubber planter. A Eurosceptic, but from a deviant One Nation Keynesian as well as Germanophobic perspective, he backed Heseltine against Thatcher, having opposed her on the poll tax. One of the last Tories to wear three-piece suits, a ponderous speaker with a patrician lisp and a face permanently tanned - it has been suggested - by the furnace of his tremendous self-esteem, he is one of the last of the grandees. He claimed that had he run for, and been elected, Speaker in 2000 he would have “looked great in tights” (because) “I have very good legs; all the women in my life have commented on this”.
 |
| Wealthy Achievers, Suburban Areas |
10.64% |
14.99% |
70.95 |
|
| Affluent Greys, Rural Communities |
24.81% |
2.13% |
1,166.84 |
|
| Prosperous Pensioners, Retirement Areas |
14.32% |
2.49% |
576.15 |
|
| Affluent Executives, Family Areas |
2.45% |
4.43% |
55.38 |
|
| Well-Off Workers, Family Areas |
2.96% |
7.27% |
40.65 |
|
| Affluent Urbanites, Town & City Areas |
0.03% |
2.56% |
1.03 |
|
| Prosperous Professionals, Metropolitan Areas |
0.00% |
2.04% |
0.00 |
|
| Better-Off Executives, Inner City Areas |
0.65% |
3.94% |
16.53 |
|
| Comfortable Middle Agers, Mature Home Owning Areas |
15.70% |
13.04% |
120.37 |
|
| Skilled Workers, Home Owning Areas |
7.55% |
12.70% |
59.47 |
|
| New Home Owners, Mature Communities |
14.43% |
8.14% |
177.25 |
|
| White Collar Workers, Better-Off Multi Ethnic Areas |
1.45% |
4.02% |
36.07 |
|
| Older People, Less Prosperous Areas |
2.36% |
3.19% |
74.02 |
|
| Council Estate Residents, Better-Off Homes |
2.62% |
11.31% |
23.17 |
|
| Council Estate Residents, High Unemployment |
0.00% |
3.06% |
0.00 |
|
| Council Estate Residents, Greatest Hardship |
0.03% |
2.52% |
1.18 |
|
| People in Multi-Ethnic, Low-Income Areas |
0.00% |
2.10% |
0.00 |
|
| Unclassified |
0.00% |
0.06% |
1.77 |
|
|
 |
|
|
| £0-5K |
11.10% |
9.41% |
117.95 |
|
| £5-10K |
20.49% |
16.63% |
123.17 |
|
| £10-15K |
19.41% |
16.58% |
117.07 |
|
| £15-20K |
14.65% |
13.58% |
107.82 |
|
| £20-25K |
10.23% |
10.39% |
98.39 |
|
| £25-30K |
6.98% |
7.77% |
89.77 |
|
| £30-35K |
4.76% |
5.79% |
82.20 |
|
| £35-40K |
3.28% |
4.33% |
75.64 |
|
| £40-45K |
2.28% |
3.27% |
69.98 |
|
| £45-50K |
1.62% |
2.48% |
65.08 |
|
| £50-55K |
1.16% |
1.90% |
60.84 |
|
| £55-60K |
0.84% |
1.47% |
57.14 |
|
| £60-65K |
0.62% |
1.15% |
53.90 |
|
| £65-70K |
0.46% |
0.91% |
51.06 |
|
| £70-75K |
0.35% |
0.72% |
48.54 |
|
| £75-80K |
0.27% |
0.57% |
46.31 |
|
| £80-85K |
0.20% |
0.46% |
44.32 |
|
| £85-90K |
0.16% |
0.37% |
42.54 |
|
| £90-95K |
0.12% |
0.31% |
40.94 |
|
| £95-100K |
0.10% |
0.25% |
39.50 |
|
| £100K + |
0.45% |
1.34% |
33.38 |
|
|
|
|


|
1992-1997
|
1997-2001
|
|
|
|
| Con |
-9.26% |
| Lab |
15.93% |
| LD |
-7.26% |
|
| Con |
5.02% |
| Lab |
1.84% |
| LD |
-4.36% |
|
|
|
Peter Tapsell
Conservative hold
|
| Con |
 |
21,543 |
48.45% |
| Lab |
 |
13,989 |
31.46% |
| LD |
 |
8,928 |
20.08% |
| Oth |
|
0 |
0.00% |
| Maj |
 |
7,554 |
16.99% |
| Turn |
|
44,460 |
62.13% |
|
|
|
Peter Tapsell
Conservative hold
|
| L |
David Bolland |
13,989 |
31.46% |
| LD |
Fiona Martin |
8,928 |
20.08% |
| C |
Peter Tapsell |
21,543 |
48.45% |
|
Candidates representing 3 parties stood for election to this seat.
|
|
|
Peter Tapsell
Conservative
|
| Con |
|
21,699 |
43.44% |
| Lab |
|
14,799 |
29.63% |
| LD |
|
12,207 |
24.44% |
| Ref |
|
0 |
0.00% |
| Oth |
 |
1,248 |
2.50% |
| Maj |
|
6,900 |
13.81% |
| Turn |
|
49,953 |
72.58% |
|
|
|
|
Conservative
|
| Con |
|
27,499 |
52.70% |
| Lab |
|
7,122 |
13.70% |
| LD |
|
16,529 |
31.70% |
| Oth |
|
1,018 |
2.00% |
| Maj |
|
10,970 |
21.00% |
| Turn |
|
52,168 |
79.05% |
|
|
|
|
|