|
Ludlow
Liberal Democrat gain

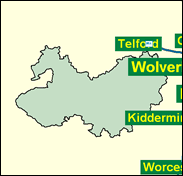
South Shropshire is an exceptionally attractive residential area, its ranges of hills building up towards the Welsh border, the eponymous town with its great castle and medieval streets a centre of civilisation, not least with a battery of high-quality restaurants such as the Merchant Houset of Shaun Hill; yet it does not seem so happy a ground for its Conservative MPs, who tend to depart at unusually short notice. Eric Cockeram withdrew from the 1987 election after multiple share dealing in privatised industries; his replacement Christopher Gill, an ardent euro-sceptic, announced his disillusionment at the end of 2000 with his party's failure to stand even more strongly against the incursions of the putative super-state. Opposition is evenly divided enough to keep these soft acres in Tory hands for yet another new candidate, though.

With the retirement of the Eurosceptic ‘Butcher of Ludlow’ Christopher Gill, the Conservatives have selected Martin Taylor-Smith, who worked for 13 years for IBM before setting up as a software consultant operating in the UK and USA and who is currently vice-president of Geneva Technology Ltd. Linked to the leading Eurosceptic Shadow Defence Secretary Iain Duncan-Smith, whom he has served as an adviser on army equipment, he is from a military background, having attended Mons Officer Cadet School and Sandhurst, and served three years in the Royal Artillery. Born 1952 and educated at Peter Symonds Grammar School, Winchester, and Harvey Grammar School, Folkestone, a Monday Clubber and a family farmer and backer of Countryside Alliance, he finds himself selected for a blue-chip seat with no previous experience as a parliamentary candidate.
 |
| Wealthy Achievers, Suburban Areas |
14.27% |
14.99% |
95.18 |
|
| Affluent Greys, Rural Communities |
26.22% |
2.13% |
1,233.09 |
|
| Prosperous Pensioners, Retirement Areas |
3.88% |
2.49% |
156.25 |
|
| Affluent Executives, Family Areas |
0.66% |
4.43% |
14.87 |
|
| Well-Off Workers, Family Areas |
6.69% |
7.27% |
91.95 |
|
| Affluent Urbanites, Town & City Areas |
0.04% |
2.56% |
1.75 |
|
| Prosperous Professionals, Metropolitan Areas |
0.53% |
2.04% |
25.79 |
|
| Better-Off Executives, Inner City Areas |
0.18% |
3.94% |
4.45 |
|
| Comfortable Middle Agers, Mature Home Owning Areas |
15.96% |
13.04% |
122.44 |
|
| Skilled Workers, Home Owning Areas |
11.13% |
12.70% |
87.62 |
|
| New Home Owners, Mature Communities |
9.77% |
8.14% |
120.01 |
|
| White Collar Workers, Better-Off Multi Ethnic Areas |
3.59% |
4.02% |
89.39 |
|
| Older People, Less Prosperous Areas |
3.25% |
3.19% |
102.15 |
|
| Council Estate Residents, Better-Off Homes |
3.16% |
11.31% |
27.98 |
|
| Council Estate Residents, High Unemployment |
0.00% |
3.06% |
0.00 |
|
| Council Estate Residents, Greatest Hardship |
0.65% |
2.52% |
25.89 |
|
| People in Multi-Ethnic, Low-Income Areas |
0.00% |
2.10% |
0.00 |
|
| Unclassified |
0.00% |
0.06% |
0.00 |
|
|
 |
 |
 |
| £0-5K |
9.23% |
9.41% |
98.06 |
|
| £5-10K |
16.91% |
16.63% |
101.67 |
|
| £10-15K |
17.12% |
16.58% |
103.26 |
|
| £15-20K |
14.03% |
13.58% |
103.29 |
|
| £20-25K |
10.65% |
10.39% |
102.44 |
|
| £25-30K |
7.86% |
7.77% |
101.15 |
|
| £30-35K |
5.77% |
5.79% |
99.68 |
|
| £35-40K |
4.25% |
4.33% |
98.15 |
|
| £40-45K |
3.16% |
3.27% |
96.65 |
|
| £45-50K |
2.36% |
2.48% |
95.22 |
|
| £50-55K |
1.79% |
1.90% |
93.87 |
|
| £55-60K |
1.37% |
1.47% |
92.62 |
|
| £60-65K |
1.05% |
1.15% |
91.46 |
|
| £65-70K |
0.82% |
0.91% |
90.40 |
|
| £70-75K |
0.64% |
0.72% |
89.42 |
|
| £75-80K |
0.51% |
0.57% |
88.53 |
|
| £80-85K |
0.41% |
0.46% |
87.72 |
|
| £85-90K |
0.33% |
0.37% |
86.98 |
|
| £90-95K |
0.26% |
0.31% |
86.30 |
|
| £95-100K |
0.21% |
0.25% |
85.68 |
|
| £100K + |
1.12% |
1.34% |
83.18 |
|
|
|

|


|
1992-1997
|
1997-2001
|
|
|
|
| Con |
-9.18% |
| Lab |
3.98% |
| LD |
4.05% |
|
| Con |
-3.02% |
| Lab |
-11.96% |
| LD |
13.53% |
|
|
 |
Matthew Green
Liberal Democrat gain
|
| Con |
 |
16,990 |
39.40% |
| Lab |
 |
5,785 |
13.41% |
| LD |
 |
18,620 |
43.18% |
| Oth |
 |
1,729 |
4.01% |
| Maj |
 |
1,630 |
3.78% |
| Turn |
 |
43,124 |
100.00% |
|
|
 |
Matthew Green
Liberal Democrat gain
|
| G |
Jim Gaffney |
871 |
2.02% |
| LD |
Matthew Green |
18,620 |
43.18% |
| UK |
Phil Gutteridge |
858 |
1.99% |
| L |
Nigel Knowles |
5,785 |
13.41% |
| C |
Martin Taylor-Smith |
16,990 |
39.40% |
|
Candidates representing 5 parties stood for election to this seat.
|
|
 |
Christopher Gill
Conservative
|
| Con |
 |
19,633 |
42.42% |
| Lab |
 |
11,745 |
25.38% |
| LD |
 |
13,724 |
29.65% |
| Ref |
|
0 |
0.00% |
| Oth |
 |
1,183 |
2.56% |
| Maj |
 |
5,909 |
12.77% |
| Turn |
 |
46,285 |
75.55% |
|
|
 |
|
Conservative
|
| Con |
 |
24,415 |
51.60% |
| Lab |
 |
10,134 |
21.40% |
| LD |
 |
12,108 |
25.60% |
| Oth |
 |
643 |
1.40% |
| Maj |
 |
12,307 |
26.00% |
| Turn |
 |
47,300 |
81.11% |
|
|
 |
|

|

