|
Luton North
Labour hold

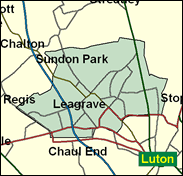
In the first elections for the new unitary authority of Luton, in May 1999, Labour won easily, beating rival parties by at least 20pc and taking control with 36 councillors to 9 for the Liberal Democrats, who have pockets of local activity, and a miserable 3 for the Conservatives. These were returned in Icknield ward in this seat, named after the Romnan road as it arrows northwards away from Luton's cosmopolitan and unglamorous downtown. More typical though are the council estates of Lewsey Farm, and Leagrave and Limbury, and the tower blocks which overlook alarmingly closely the M1 just to the west. Clearly the Tories have a giant cliff face to climb to competitiveness in the largest Bedfordshire town.

Kelvin Hopkins, bald and trim-bearded, won here in 1997 and promptly joined the Campaign Group, one of only 10 of the 183-strong 1997 intake to do so. A former Unison/Nalgo research officer, he was born 1941 and educated at Queen Elizabeth Grammar School, Barnet and Nottingham University. He has turned up for all the major rebellions, on lone parent benefit cuts, student grants, Murdoch predatory pricing, freedom of information, the Prime Minister’s right to nominate life peers, jury trial curbs, legal aid reforms, pensions, disability benefit cuts and air traffic control privatisation - the full Campaign Group diet of dissidence.
 |
| Wealthy Achievers, Suburban Areas |
7.23% |
14.99% |
48.23 |
|
| Affluent Greys, Rural Communities |
0.00% |
2.13% |
0.00 |
|
| Prosperous Pensioners, Retirement Areas |
0.81% |
2.49% |
32.78 |
|
| Affluent Executives, Family Areas |
12.92% |
4.43% |
291.89 |
|
| Well-Off Workers, Family Areas |
11.76% |
7.27% |
161.74 |
|
| Affluent Urbanites, Town & City Areas |
1.49% |
2.56% |
58.02 |
|
| Prosperous Professionals, Metropolitan Areas |
0.00% |
2.04% |
0.00 |
|
| Better-Off Executives, Inner City Areas |
0.21% |
3.94% |
5.41 |
|
| Comfortable Middle Agers, Mature Home Owning Areas |
9.37% |
13.04% |
71.86 |
|
| Skilled Workers, Home Owning Areas |
17.58% |
12.70% |
138.38 |
|
| New Home Owners, Mature Communities |
4.86% |
8.14% |
59.71 |
|
| White Collar Workers, Better-Off Multi Ethnic Areas |
4.49% |
4.02% |
111.72 |
|
| Older People, Less Prosperous Areas |
1.54% |
3.19% |
48.24 |
|
| Council Estate Residents, Better-Off Homes |
21.35% |
11.31% |
188.79 |
|
| Council Estate Residents, High Unemployment |
1.21% |
3.06% |
39.37 |
|
| Council Estate Residents, Greatest Hardship |
2.51% |
2.52% |
99.81 |
|
| People in Multi-Ethnic, Low-Income Areas |
2.66% |
2.10% |
126.61 |
|
| Unclassified |
0.00% |
0.06% |
0.00 |
|
|
 |
 |
 |
| £0-5K |
8.27% |
9.41% |
87.87 |
|
| £5-10K |
15.71% |
16.63% |
94.48 |
|
| £10-15K |
16.49% |
16.58% |
99.48 |
|
| £15-20K |
14.01% |
13.58% |
103.14 |
|
| £20-25K |
10.97% |
10.39% |
105.59 |
|
| £25-30K |
8.32% |
7.77% |
107.00 |
|
| £30-35K |
6.23% |
5.79% |
107.58 |
|
| £35-40K |
4.66% |
4.33% |
107.49 |
|
| £40-45K |
3.49% |
3.27% |
106.91 |
|
| £45-50K |
2.63% |
2.48% |
105.94 |
|
| £50-55K |
1.99% |
1.90% |
104.70 |
|
| £55-60K |
1.52% |
1.47% |
103.25 |
|
| £60-65K |
1.17% |
1.15% |
101.67 |
|
| £65-70K |
0.91% |
0.91% |
100.00 |
|
| £70-75K |
0.71% |
0.72% |
98.28 |
|
| £75-80K |
0.55% |
0.57% |
96.53 |
|
| £80-85K |
0.44% |
0.46% |
94.77 |
|
| £85-90K |
0.35% |
0.37% |
93.02 |
|
| £90-95K |
0.28% |
0.31% |
91.29 |
|
| £95-100K |
0.22% |
0.25% |
89.58 |
|
| £100K + |
1.07% |
1.34% |
79.25 |
|
|
|

|


|
1992-1997
|
1997-2001
|
|
|
|
| Con |
-16.90% |
| Lab |
17.44% |
| LD |
-1.02% |
|
| Con |
-3.09% |
| Lab |
2.07% |
| LD |
0.62% |
|
|
 |
Kelvin Hopkins
Labour hold
|
| Con |
 |
12,210 |
31.21% |
| Lab |
 |
22,187 |
56.71% |
| LD |
 |
3,795 |
9.70% |
| Oth |
 |
934 |
2.39% |
| Maj |
 |
9,977 |
25.50% |
| Turn |
 |
39,126 |
59.28% |
|
|
 |
Kelvin Hopkins
Labour hold
|
| UK |
Colin Brown |
934 |
2.39% |
| L |
Kelvin Hopkins |
22,187 |
56.71% |
| LD |
Bob Hoyle |
3,795 |
9.70% |
| C |
Amanda Slater |
12,210 |
31.21% |
|
Candidates representing 4 parties stood for election to this seat.
|
|
 |
Kelvin Hopkins
Labour gain
|
| Con |
 |
16,234 |
34.30% |
| Lab |
 |
25,860 |
54.64% |
| LD |
 |
4,299 |
9.08% |
| Ref |
|
0 |
0.00% |
| Oth |
 |
939 |
1.98% |
| Maj |
 |
9,626 |
20.34% |
| Turn |
 |
47,332 |
73.25% |
|
|
 |
|
Conservative
|
| Con |
 |
26,853 |
51.20% |
| Lab |
 |
19,496 |
37.20% |
| LD |
 |
5,311 |
10.10% |
| Oth |
 |
750 |
1.40% |
| Maj |
 |
7,357 |
14.00% |
| Turn |
 |
52,410 |
81.18% |
|
|
 |
|

|

